My Conscience Weighs Heavily Upon Me
Of late, I have been asked a number of times to provide a bullish alternative which outlines how we go to 3800+ from here.
For those that have followed my work for some time, you know that I take apart structures in many different ways to identify which counts are most probable. To that end, I spend a significant amount of time calculating many different potential wave structures. At the end of the day, I provide you two (sometimes even three) potential wave structures I am tracking, but they are the ones I see as most likely after reviewing many, many different alternatives.
However, even after scrubbing my charts over and over, I am actually unable to provide a bullish alternative which I view as even being reasonably probable which suggests we are now on our way to 3800+ from here. Rather, I have highlighted that all roads to reasonably probable wave counts pointing that high should actually start from lower. Meaning, my most bullish waves count still should see a [c] wave down, which would complete the alternative wave ii in blue on my charts. (Yet, that still is my alternative for all the same reasons I have outlined many times before).
While I can always provide wave counts that are extremely bullish when the market is going up, it would require me to contort my analysis in such a manner as it would be akin to me scratching my right ear with my left hand by going over the top of my head. And, since I need to be honest in my analysis to you, my conscience does not allow me to post such type of bullish wave counts every time the market moves up. Such analysis would have had you uber-bullish at every market high since May.
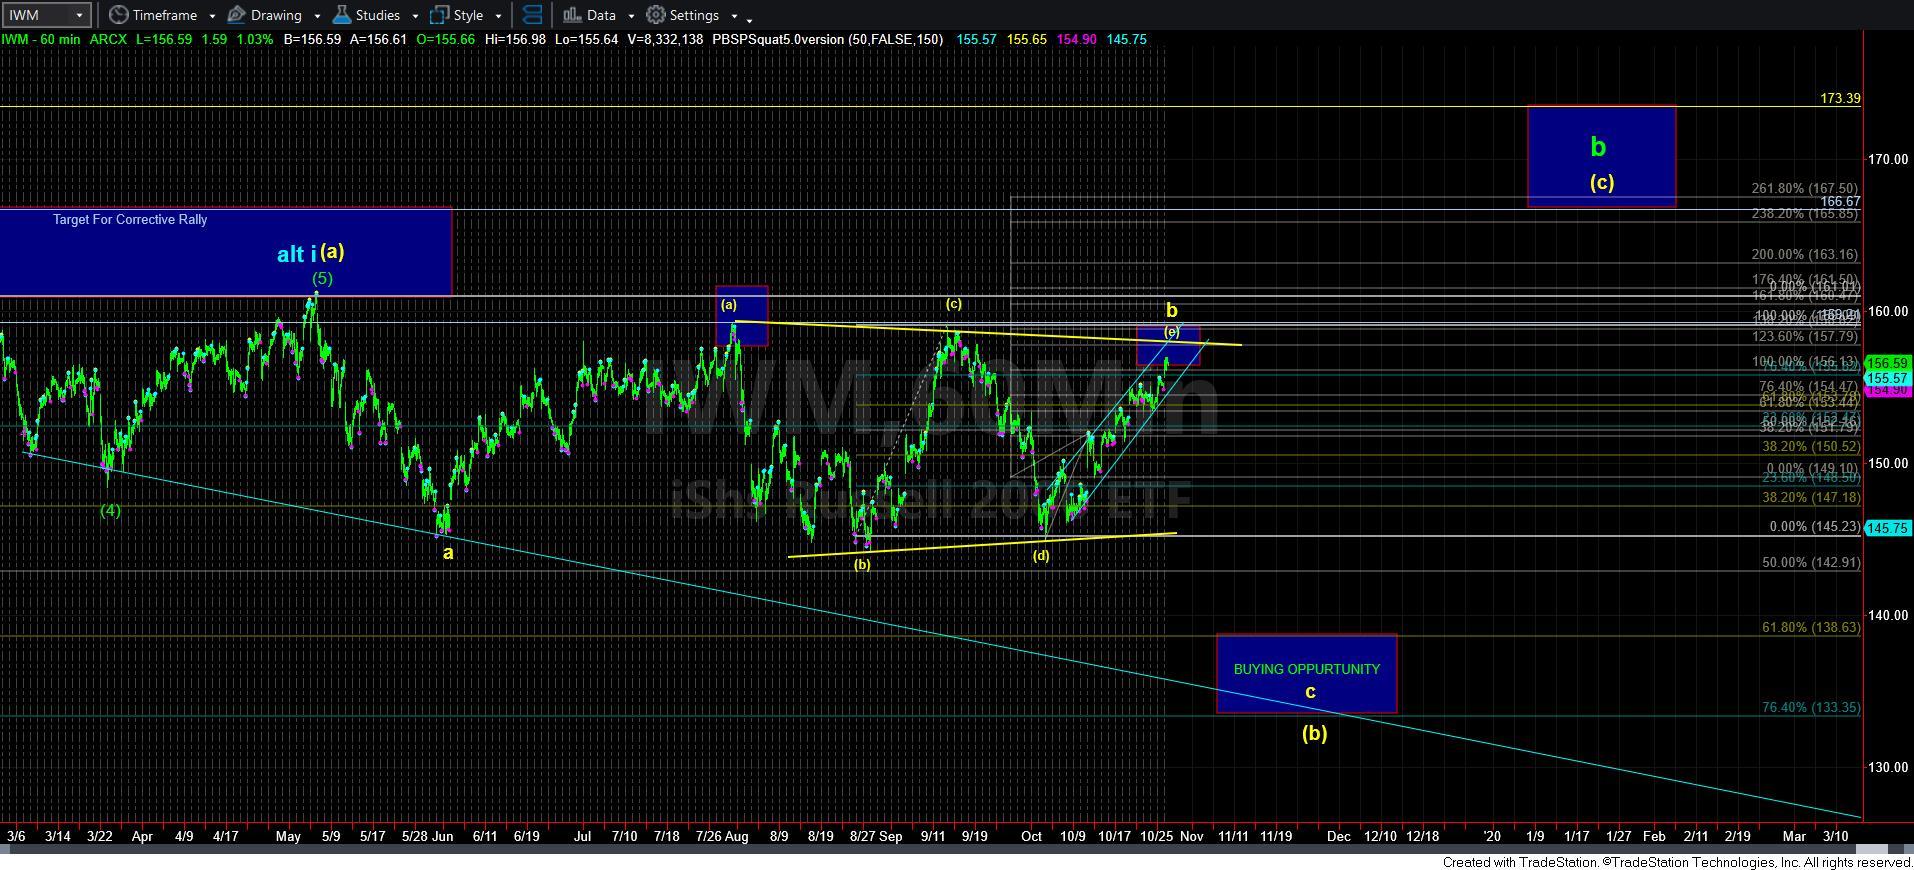
Moreover, when I keep coming back to the IWM chart, one cannot help but see the consolidation as presenting as a strong potential for a triangle. There are two positions in which we see triangles the significant majority of the time, and both are continuation patterns. The first is in a b-wave within an a-b-c structure, and the second is within a 4th wave. Since this is clearly not a 4th wave, my presumption is that it is a b-wave. And, since it is a continuation pattern, it suggests that we will likely continue lower since it began after the initial a-wave move down off the early May high. So, again, I have a hard time in viewing even this pattern as presenting in a bullish perspective at this time, at least until we resolve lower first.
What this still leaves me with is that the most likely wave structure still presents as us completing a b-wave pattern in the charts we track. And, once this current structure completes, I still view the greater likelihood as the market resolving lower to set up the next major rally.
So, rather than simply providing you with a bullish wave count from here, I have to remain honest and objective in my analysis. While I will not always be right in my analysis, anyone following us for years knows that we are right a heck of a lot more often than we are wrong, and we will always remain honest and objective with our analysis.
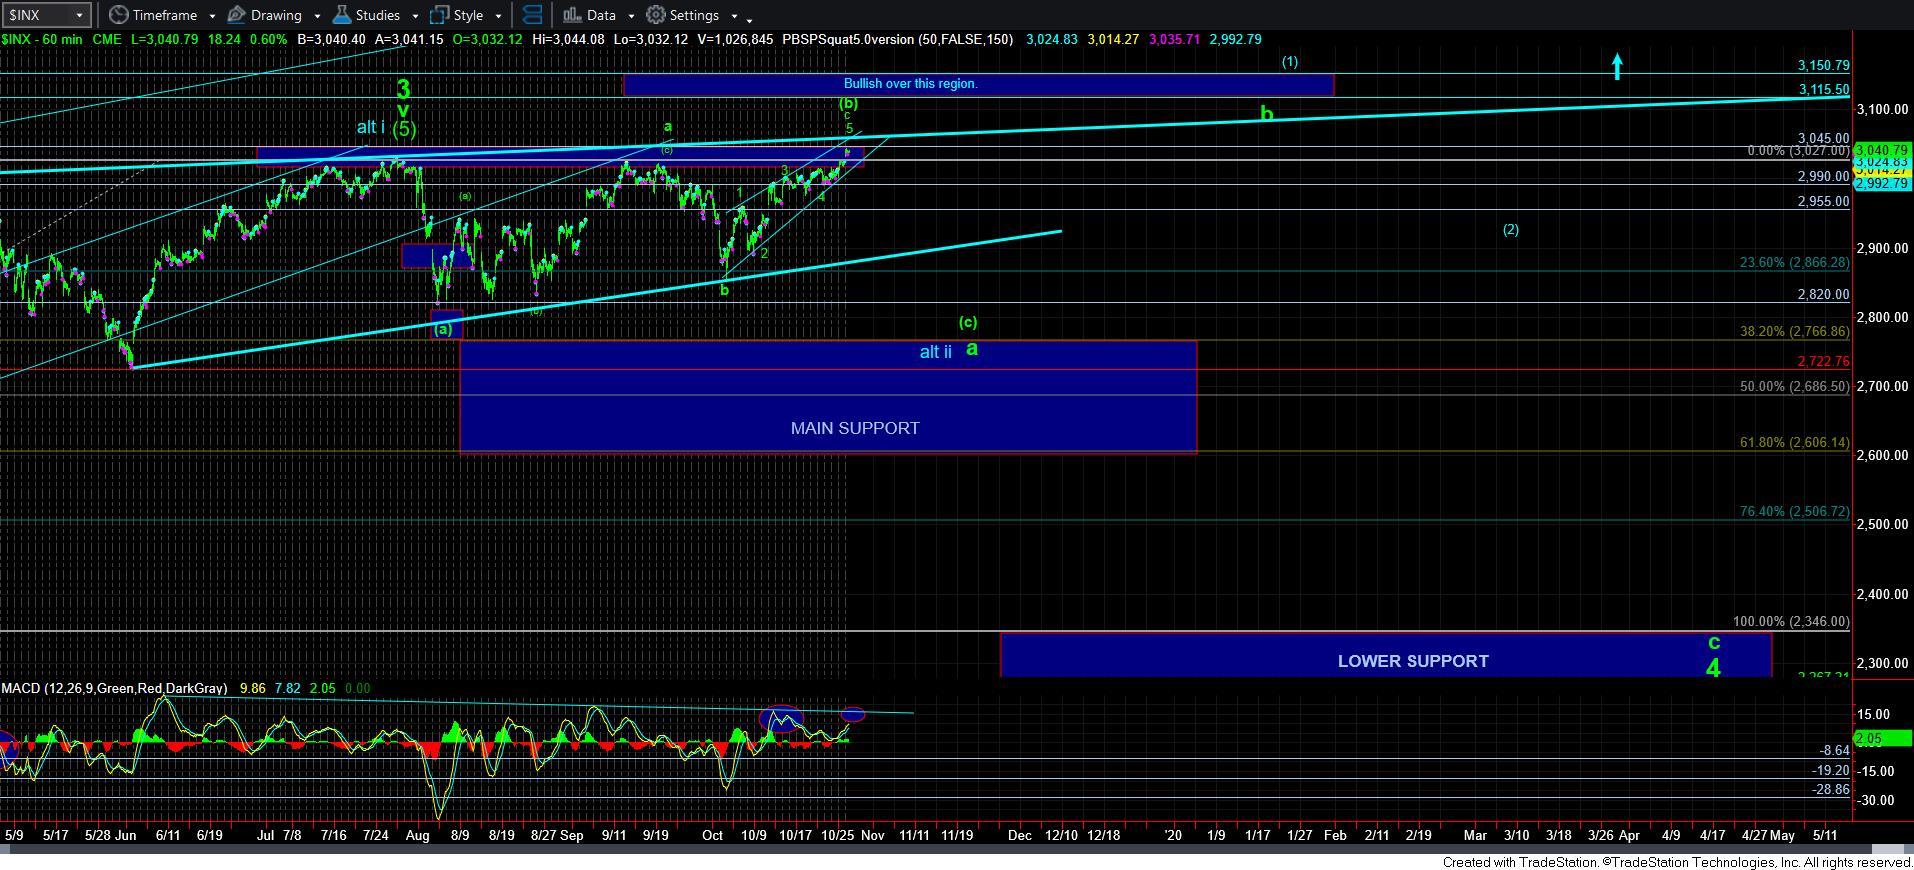
Therefore, I am still viewing us as completing a c-wave which should complete this b-wave rally. But, that does not mean the market is going to turn down at this very moment. The micro structure can still support another push higher. So, support is now over 3030SPX, with a break down and follow through below last Friday’s low in the 3016 region as being our initial signal that this b-wave rally has potentially run out of room.
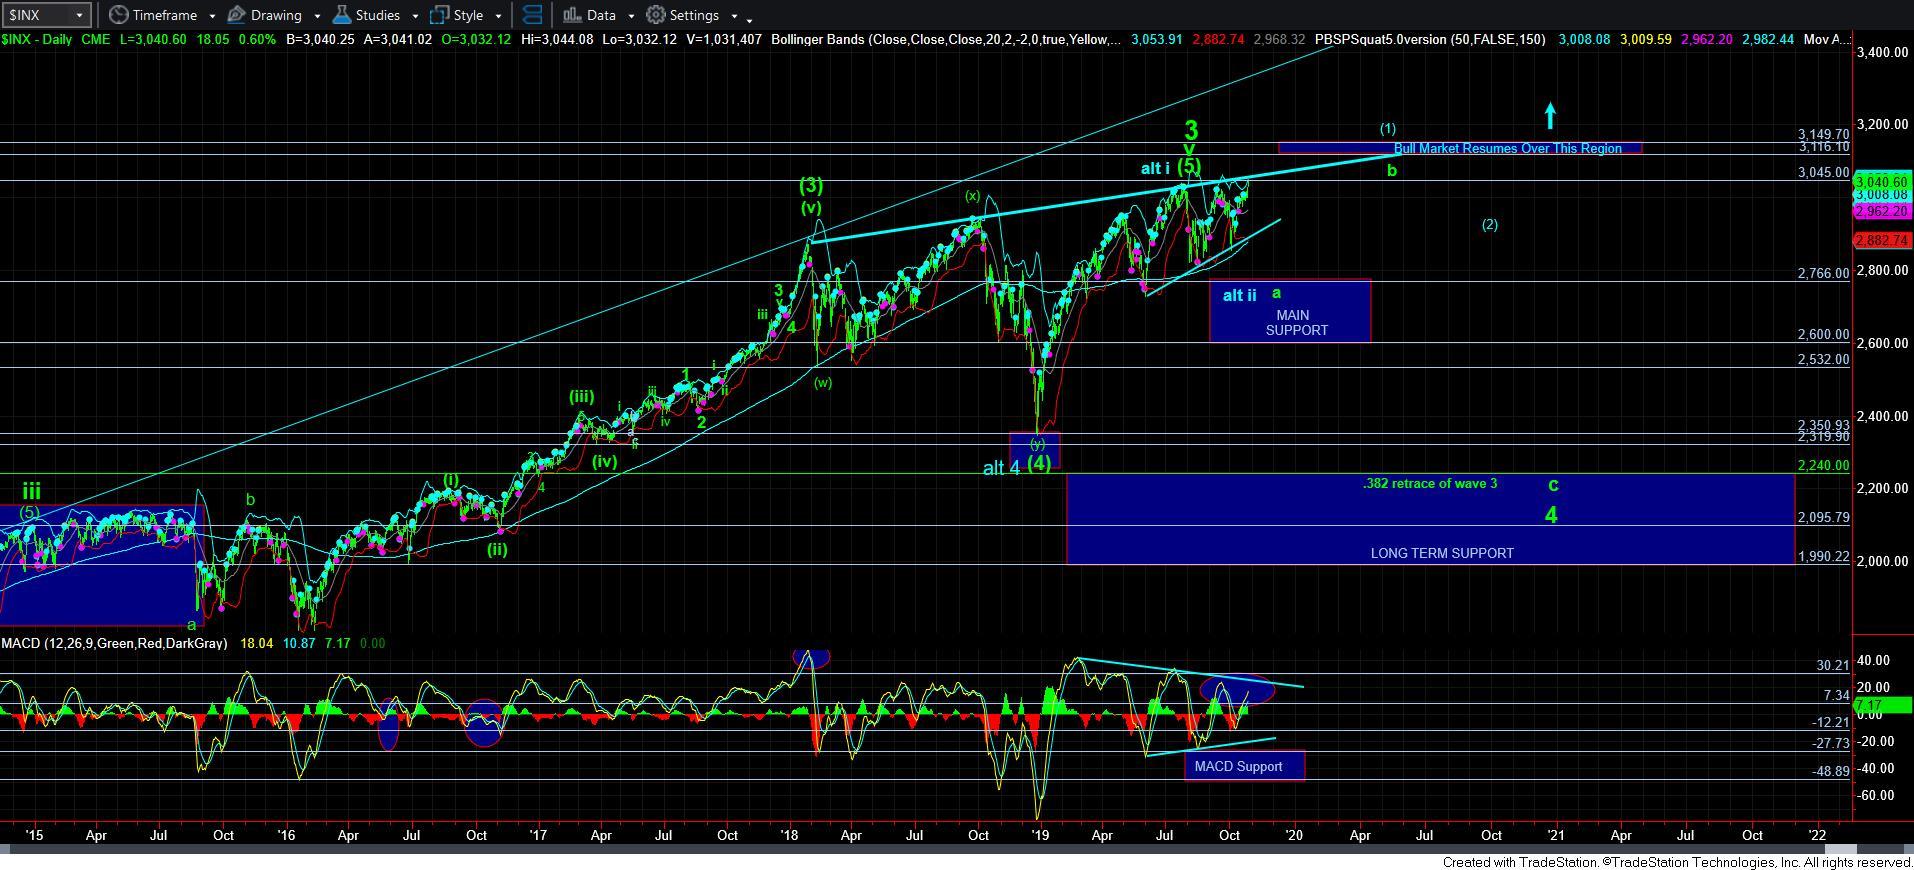
To this end, I want to highlight how the MACD on the 60-minute SPX chart is seriously diverging despite the new all-time high struck by the SPX. Moreover, we are now hovering just below a long term resistance line, with the daily MACD now approaching resistance as well. To me, this is not suggestive of a continuation rally from here, other than filling in the last remnants of the c-wave.
So, while much of the world seems to be getting giddy with excitement regarding the new all-time high we struck today in the SPX, I still have the same problems with the larger degree structures up here. Moreover, with the Fed having to provide the equivalent of QE4, along with the potential of another rate reduction this week as the market is hitting all-time highs, I am sorry to say that there are just too many things that make me cringe.
As many you know, I went to cash with 20-30% of my stock positions (depending upon the specific portfolio) last year when the market broke below 2880SPX, and put that into TLT. We earned about 25% on that money, and it is still sitting in cash right now since I exited TLT at 140. It has been hard for me to keep that money out of the market because I have targets overhead to 3800+. Yet, I simply cannot place that money into the market up here, especially when I review many of the underlying charts.
So, for now, I simply cannot turn bullish up here in all good conscience just because we hit new all-time highs. I am going to maintain patience, and allow the market to exhaust itself with this move up, and signal that we are heading lower in the [c] wave I am still expecting when it begins to break below support. For now, support begins at 3030, and a follow through to the downside below this past Friday’s low in the 3016 region would be an initial indication that we have exhausted ourselves to the upside. Clearly, I will still need to see a break down below 2970/90 to be looking confidently down to at least the 2820SPX region, and potentially even lower for the next buying opportunity.