Much More Clarity - Market Analysis for Jul 2nd, 2020
With the gap up today, I wanted to send out a note to the entire membership, as it seems the market has made the current scenario MUCH clearer in the near term.
As we noted earlier this week, the move over the 3060ES region opened the door to much higher potential. And, once the market moved through the 3106ES region, it suggests that we could attain the 3180-3230 region next. So, we are now approaching that resistance.
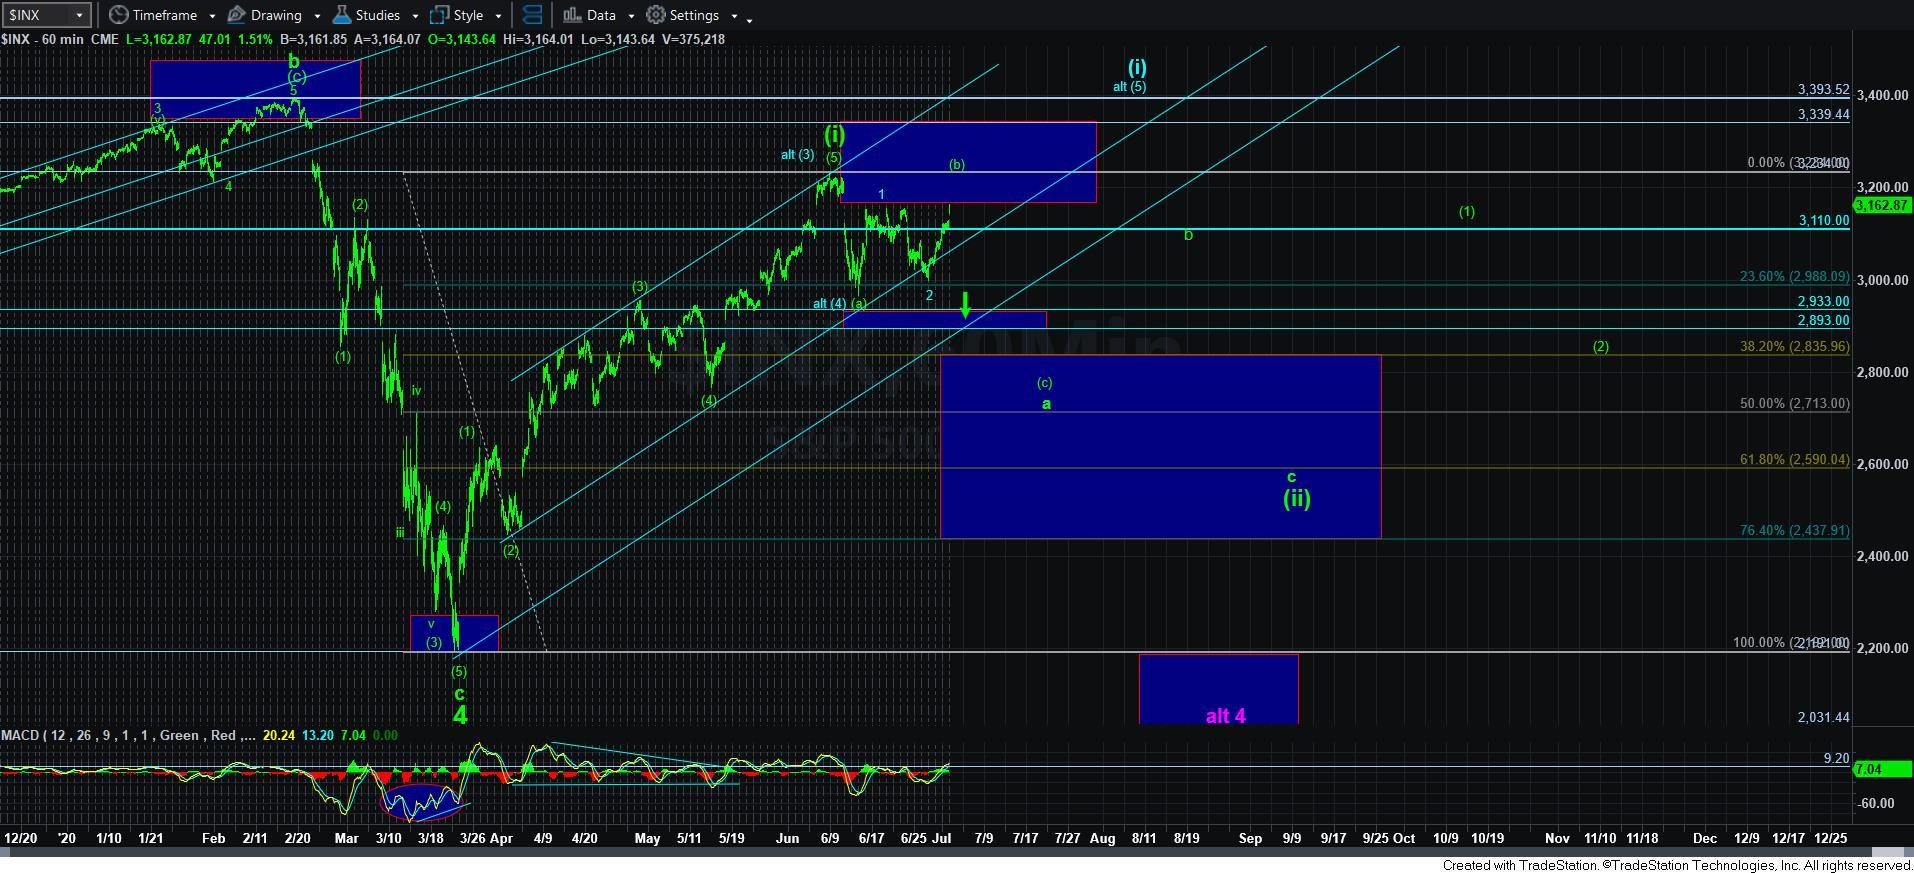
Based upon much of what I am seeing, I think the [b] wave potential is more likely at this time. But, that can still push us back up towards as high as the 3234SPX region.
I also penned this update this morning, which explains why I think the [b] wave potential is greater at this time:
As you know, I am always looking for where I can be wrong in my expectations. So, here it is, and it is in furtherance of the post I made about half hour or so ago.
Our upper resistance is in the 3205/20ES region region right now. And, the ONLY way I can account for a DIRECT break out is shown in blue now. There are MANY issues with this structure based upon our standards.
Such a wave (i) would best count as a leading diagonal. in the ES, whereas I really don't have anything like it in the SPX that matches - which is itself our first issue with this potential
But, if this would be a leading diagonal, it means that the retracement is MOST OFTEN a deep wave (ii). While I have seen some shallow 2nd waves after leading diagonals, they are not commonplace and a lower likely scenario. This is the second issue I have with this potential DIRECT break out to 3400.
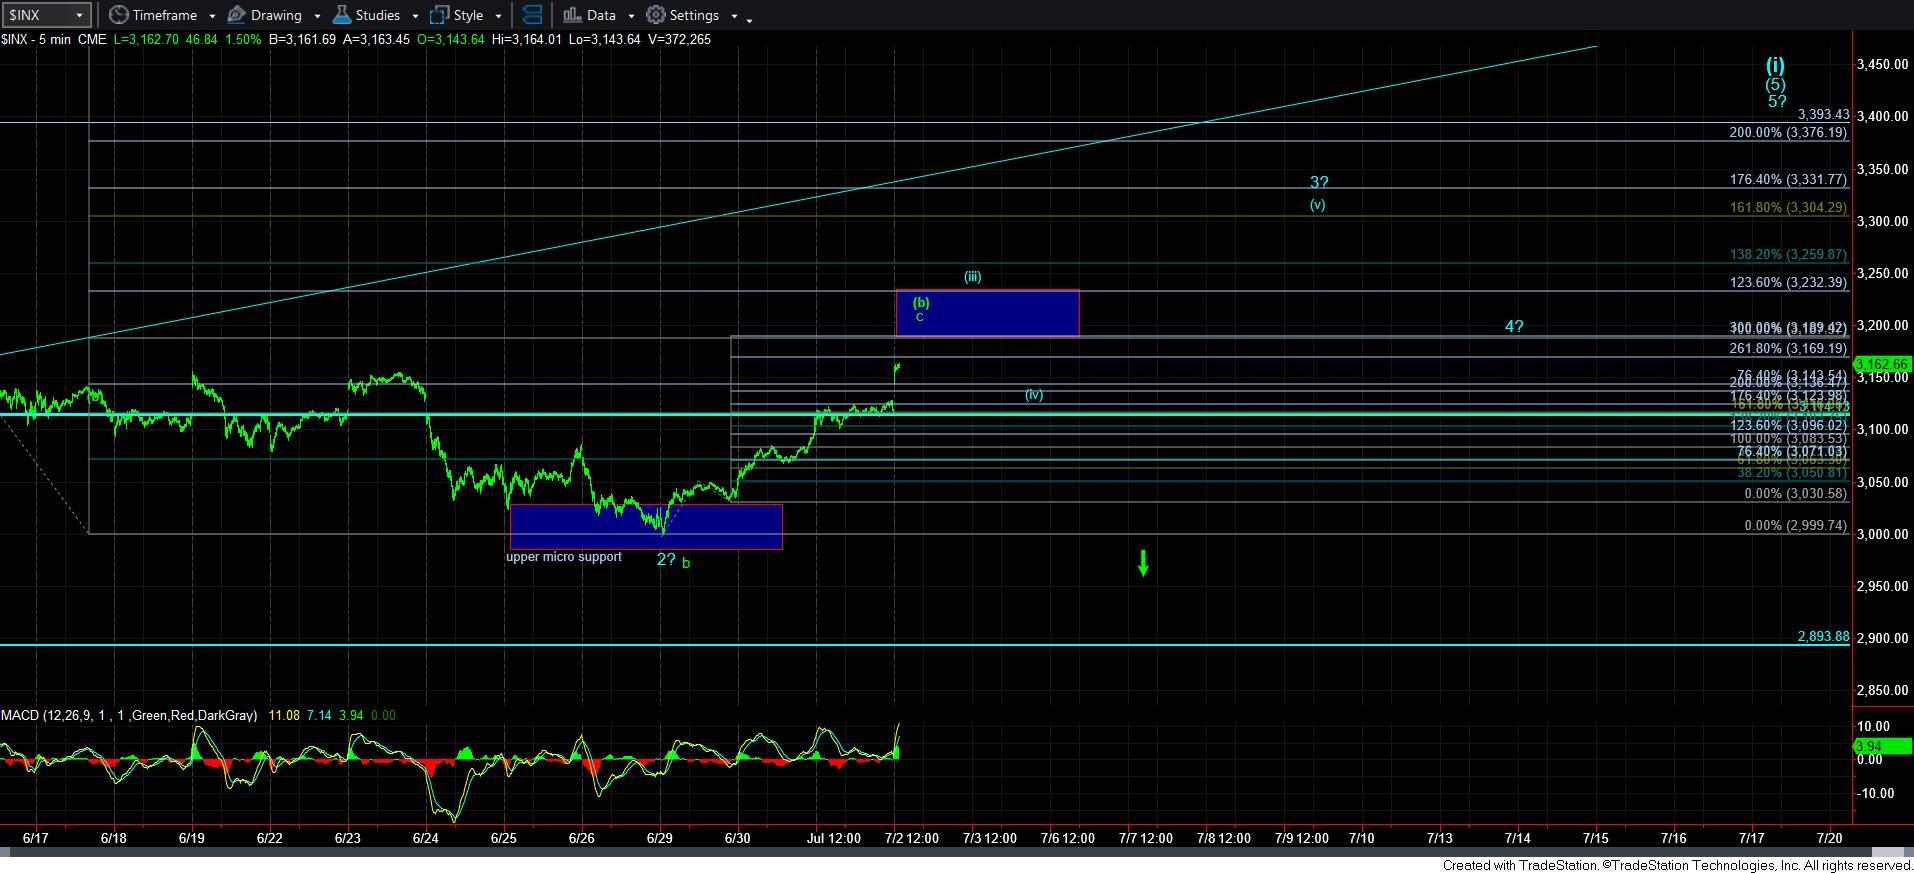
However, if the market is able to exceed the 3205/20ES resistance region, I have no choice but to adopt the blue count pointing us to 3400SPX region. It would point us towards the 3250ES region for wave (iii) of 3 in wave (5) in blue, with wave (iv) of 3 likely coming back to retest the 3200ES break out region from above with 3150ES being support. If that holds, then we are likely heading towards the 3300-3350ES region for wave (v) of 3, again ultimately on our way back up towards the 3400SPX region.
For now, I cannot say the facts are strongly supporting that potential at this time. But, I have to outline where those facts would change probabilities and where I would have to adopt the blue count direct to 3400. For now, I am expecting a topping in this region.
Therefore, 3110SPX is now the micro support for the blue count, and should we see a sustained break of that support, then probabilities turn quite high that we are likely heading back down to the 2900 region, and potentially even lower.
However, if the market continues its current strength as outlined above, then I will have to adopt the more direct path to the 3400SPX region. But, as I also noted, there are many issues with that potential which is why I am leaning towards the green topping count right now.
In the meantime, I wanted to provide the additional clarity that I am seeing based upon today’s gap up.