Moving More Towards Blue/Purple
With the market moving through the pivot noted yesterday, it is starting to provide us with initial indications that I will be changing my primary analysis towards the blue/purple counts.
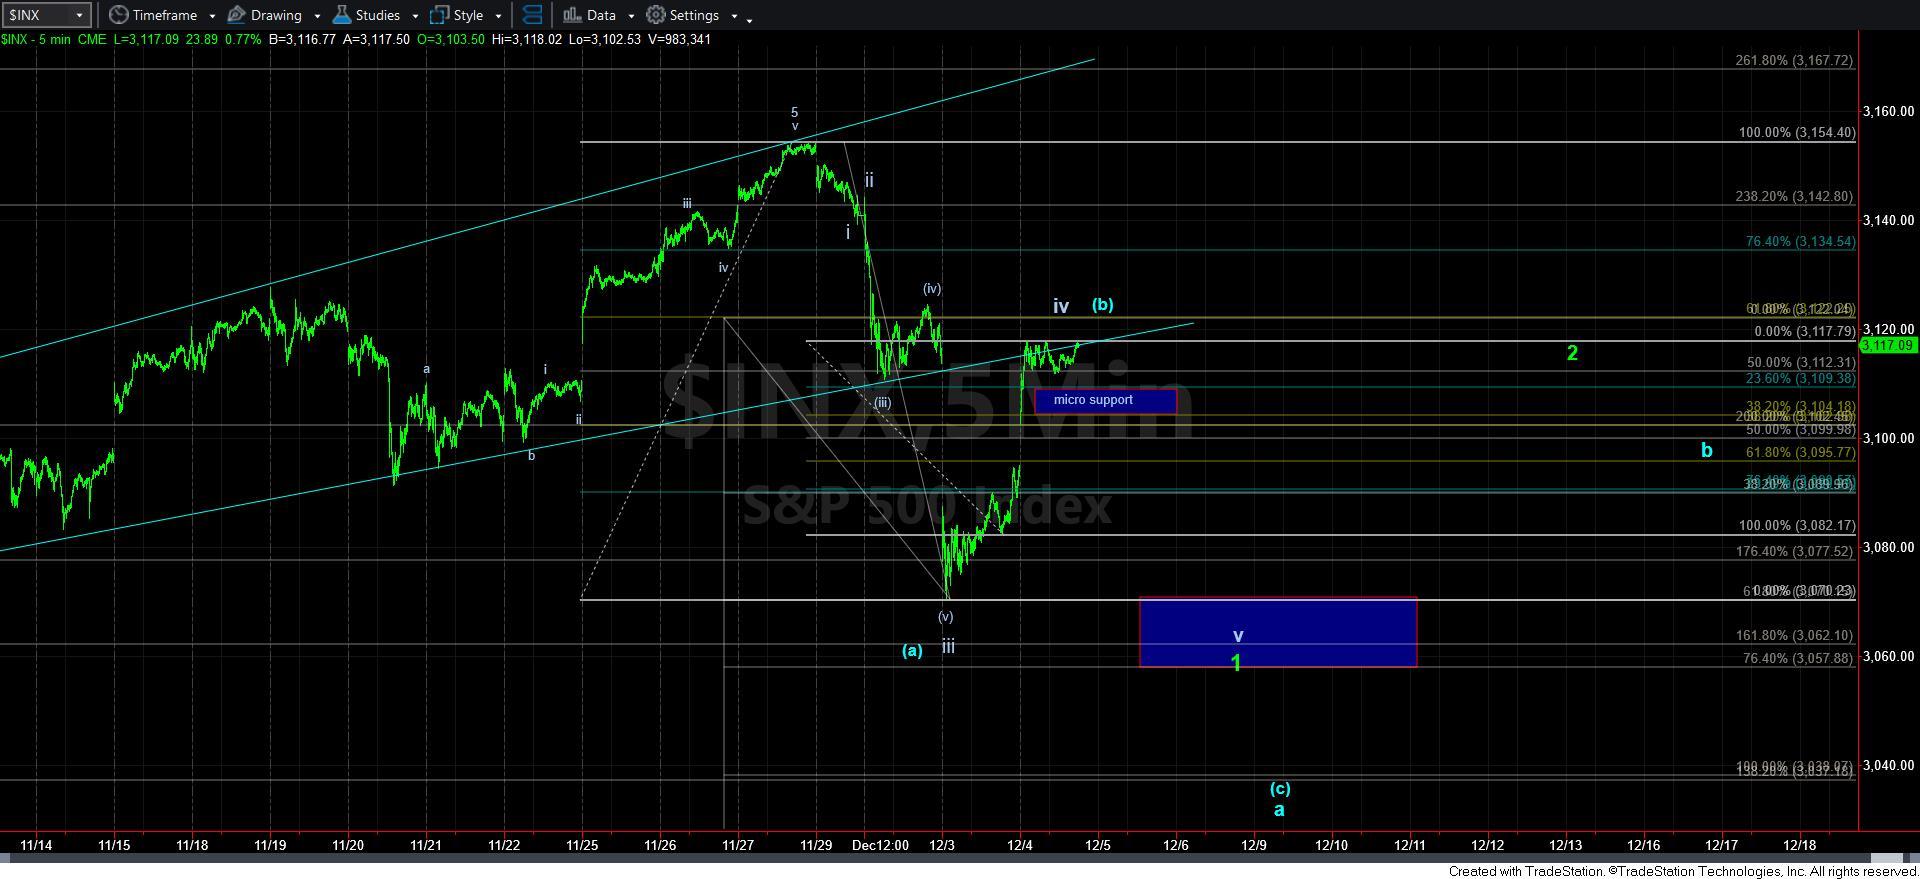
However, before I am willing to change primary counts, I am going to have to see how the next decline takes shape. If you look at the 5-minute SPX chart, you will see why.
If the market drops down and holds the support box below, then I can still view this decline as a 5-wave structure, and maintain the green count. However, due to how high we have bounced today, I think the blue count may be more applicable. Yet, I am going to maintain an open mind and see how the next decline takes shape before I make my decision on this. But, I wanted to at least apprise you of the potential in the spirit of transparency so that you are not surprised down the road.
For those that have followed my analysis, the blue/purple counts would suggest that the decline we have begun is corrective in nature, which will then set us up to rally towards the 3200SPX region by early next year. However, where they diverge is what the market does thereafter.
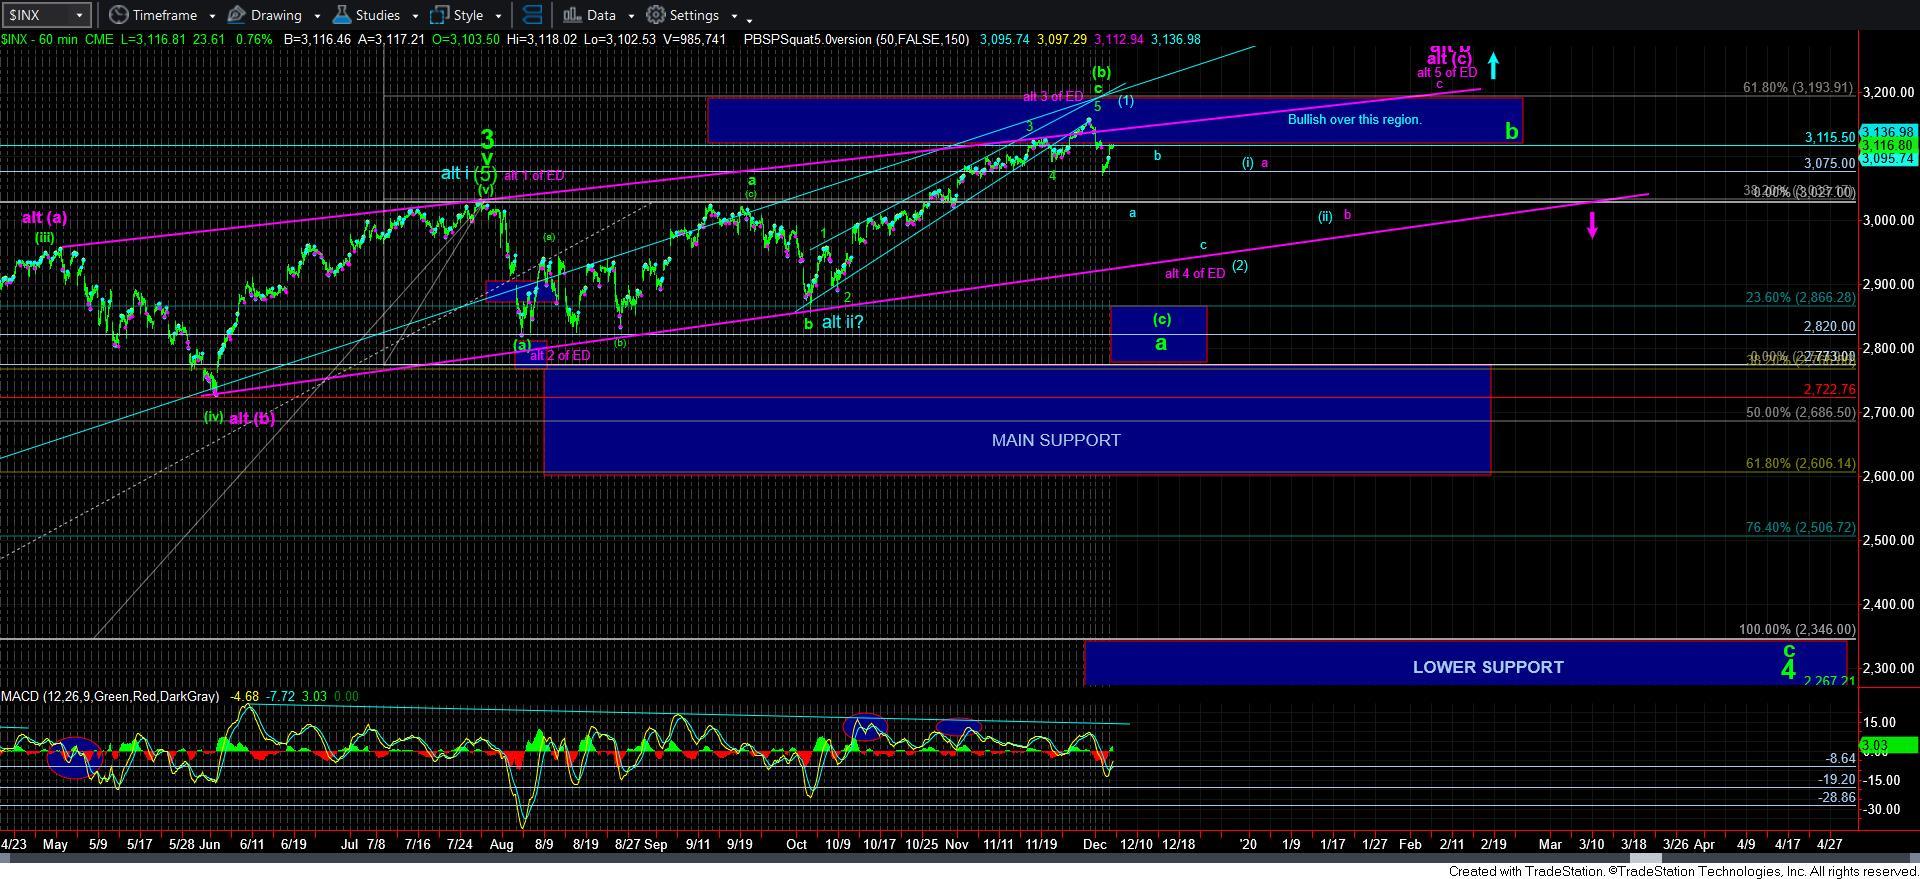
You see, the purple count is tracking this rally off the December 2018 lows as a b-wave in a larger degree wave 4, with this pullback being a 4th wave in an ending diagonal c-wave of that larger b-wave. You can see this more clearly on the 60-minute SPX chart. But, what is interesting about this count is that it will track EXACTLY as the most bullish count presented in blue. The difference is that we will break down after striking that 3200SPX region in early 2020. So, we will clearly be raising our supports into early 2020 based upon our Fibonacci Pinball structure. And, should we break a support, that would place us squarely into the purple count, which will be targeting a larger degree decline towards the 2200SPX region in 2020.
Yet, since both counts will be playing out in almost the exact same fashion over the coming months, we really do not have the treat them differently. That means that if the market proves this is a corrective decline over the coming week, then we will likely have a buying opportunity around the 2900-2950SPX region, as we approach the purple uptrend channel on the 60-minute chart, which coincides with the 200DMA.
But, for now, I am expecting this rally to top out shortly, and resume a downside move. Should that next downside move break below the blue box on my 5-minute chart, then I will likely be moving into the blue/purple counts as my primary for the next few months, until they diverge in early 2020.