Moving Into The Support Zone
 By
By
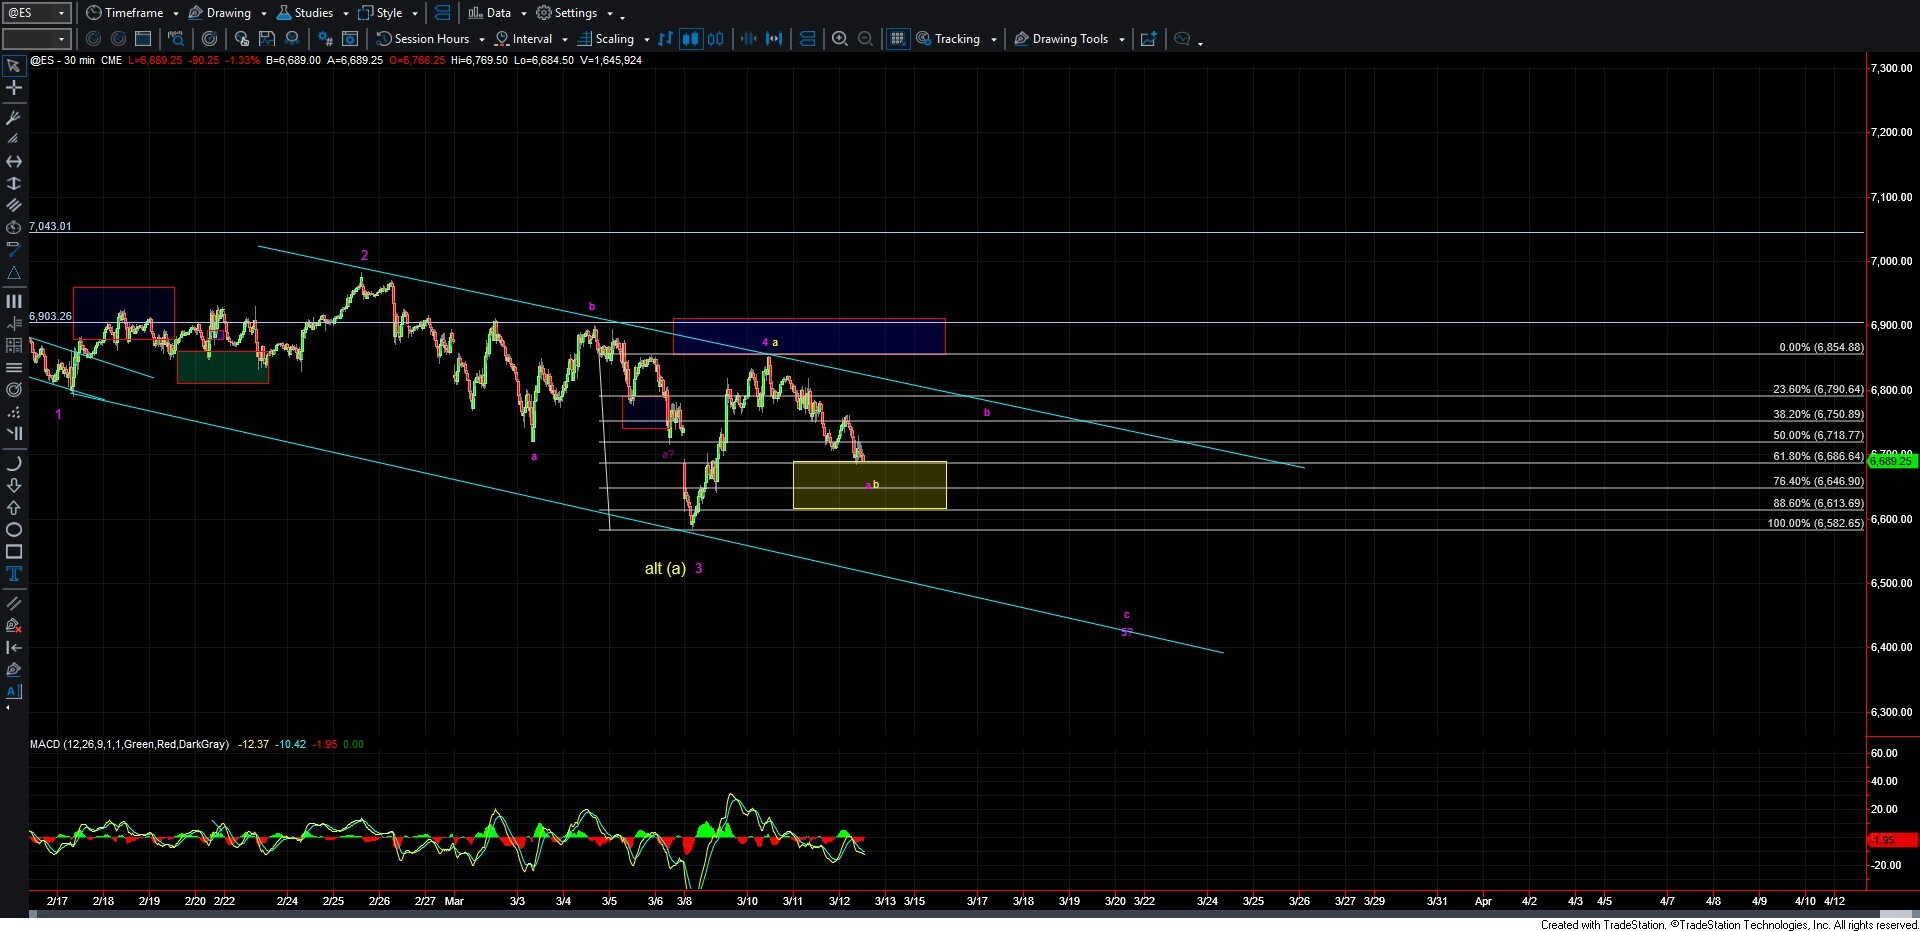
Overnight, we saw the market move lower in what is, so far, corrective wave action, following the general path and structure to the downside into the lower support zone that I outlined in yesterday’s update. With that in mind, we now need to see how the market reacts in this region and, more importantly, what the next move to the upside looks like from a structural perspective. That will help provide further guidance as to whether we ultimately see another lower low per the purple count, or if this market finds a bottom in the yellow wave (b).
As I noted yesterday, the 6689–6617 zone is an important support region, which we are now entering. If we are able to hold this support zone and then turn up in five waves, it would suggest that we may have potentially bottomed in all of wave (a) shown in yellow.
If, however, the move to the upside remains corrective in nature, then it would suggest that we still have at least one more lower low to go before completing this initial move down, likely as part of an Ending Diagonal for wave c of (a) as shown in the purple count.
Because we are likely tracing out a larger Ending Diagonal to the downside, it will be the structure of the next move higher that will likely determine which path the market is following, as the downside action in both counts can still take on a corrective form.
For now, we simply need to watch how the market reacts within this support region and then evaluate the structure of the next move higher once a local bottom is established.