Morning Update - Market Analysis for Dec 30th, 2024
 By
Avi Gilburt
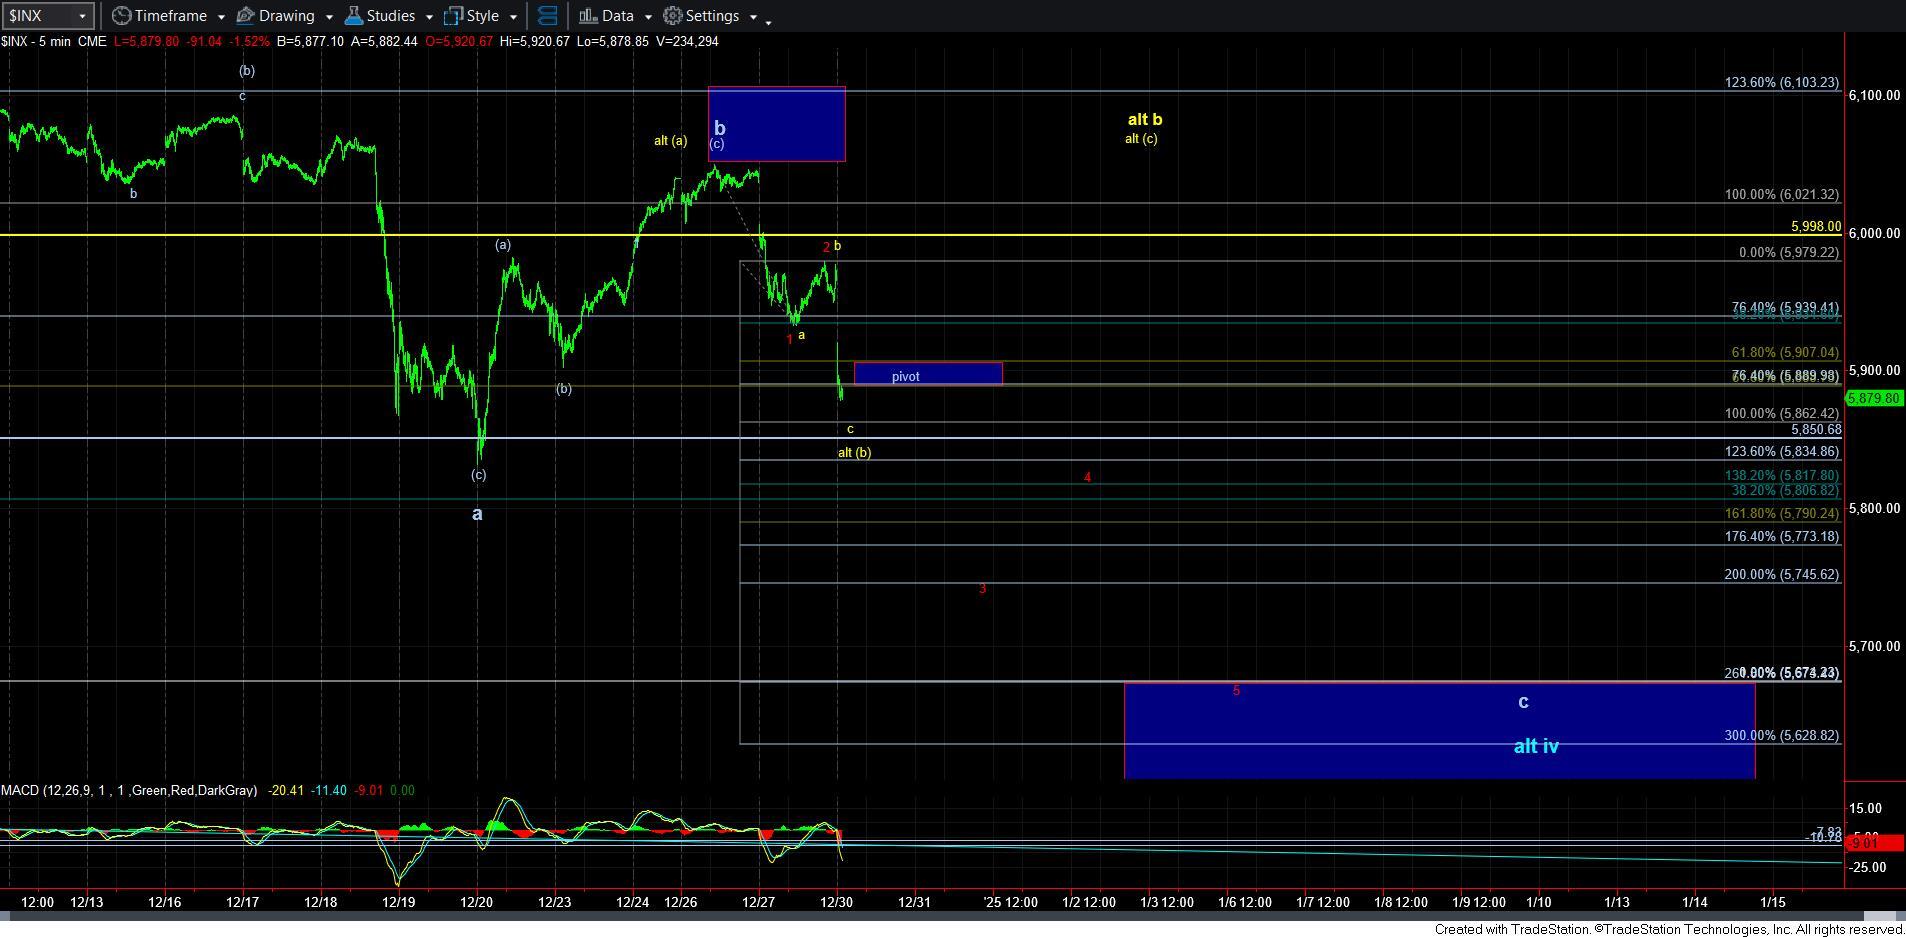
I did not necessarily expect an immediate decline scenario in the weekend update since the market only retraced .382 of the prior decline, which is quite shallow for a 2nd wave. But, the potential now exists, as presented by the red wave count.
But, clearly, it is hard to trust downside follow through in the equity market, as that has not been its nature for quite some time. So, I am always considering alternatives which can cause the maximum pain to both sides right now.
In the spirit of maximum pain, I want everyone to consider the potential for a bigger b-wave, as shown in this SPX chart. This alternative yellow count (which is different than the one shown on the weekend update) does not call for a higher high. Rather, it would be a [c] wave in an ongoing b-wave. And, if you remember, b-waves are notorious for whipsaw, which is why I always seek out these types of potentials to trip traders up.
For now, 5907-5910SPX is our resistance. As long as we remain below that resistance, pressure will remain down. However, if the market is able to exceed that resistance in an impulsive manner, we have to become VERY aware of this ongoing b-wave potential. The ideal support for this bigger yellow b-wave is the a=c off last week's high, which is 5862SPX. As long as we are over that level, I retain concern for another rally before the decline takes hold.
And, if we do continue to drop lower, I may even retain the yellow alternative all the way down to the 5790SPX region, which is the 1.618 extension of this red 1-2, and also the region at which the ES bottomed at lower levels than the SPX. While it would present us with an almost perfect b-wave flat potential in ES, it would mean an expanded flat in SPX.
So, the main point I am trying to make is that, yes, pressure is now down as long as we remain below 5907-5910SPX. But, please do not assume this is a slam dunk just yet.