More Whipsaw To Come
Early this morning, the market gave us hints of a drop to the 2700 region, which I posted as an alert. And, as it followed through, it certainly provided us with the potential long side set up we were looking for to take us back to the 2860SPX region in a bigger (b) wave rally. However, as I noted over the weekend, should we break below 2700, and follow through below 2690SPX, it certainly makes that potential much less likely, and opens the door to the alternative count I had on my 60-minute chart in yellow.
At this point in time, I have adopted that alternative as my primary count. And should we see a break down below 2670SPX it would go a very long way in solidifying the potential that the 2600 region is likely our next lower target in the coming days.
In order to better provide guidance as to how I see this more complex potential, I outlined it in an update today, and I am reposting it below:
I apologize for the further complexity with which we now have to deal with due to the depth of the drop today, but I think you would rather know what we are seeing up front, no matter how complex. I will try to distill it in as simple a way I can.
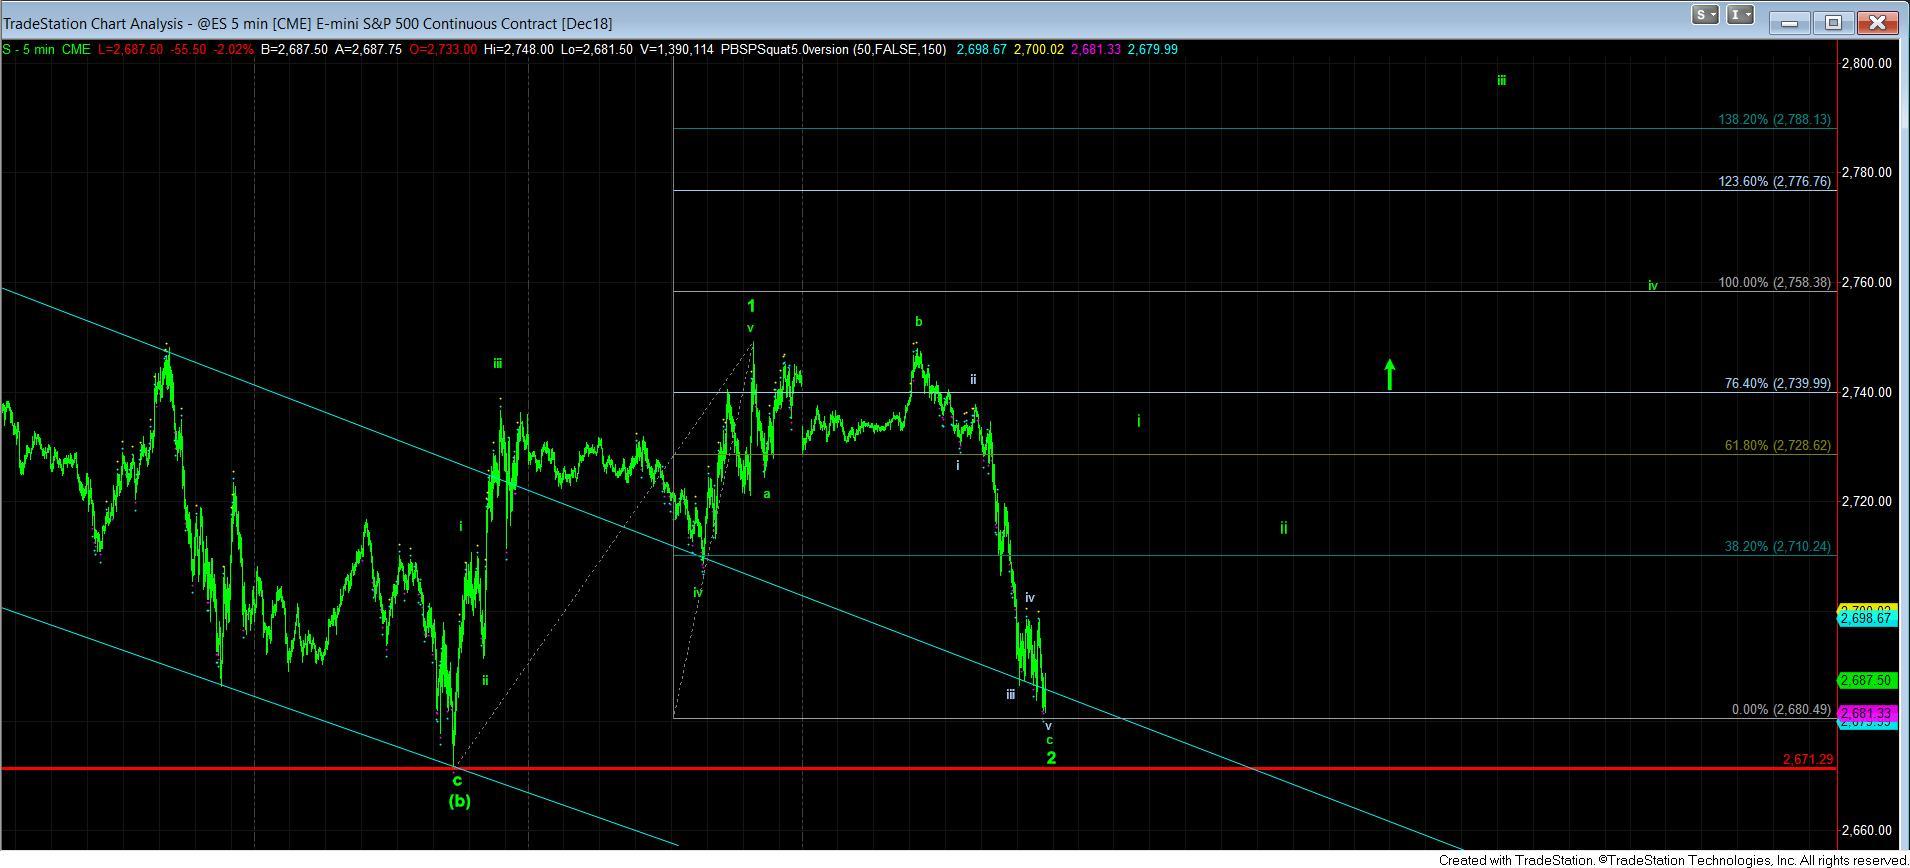
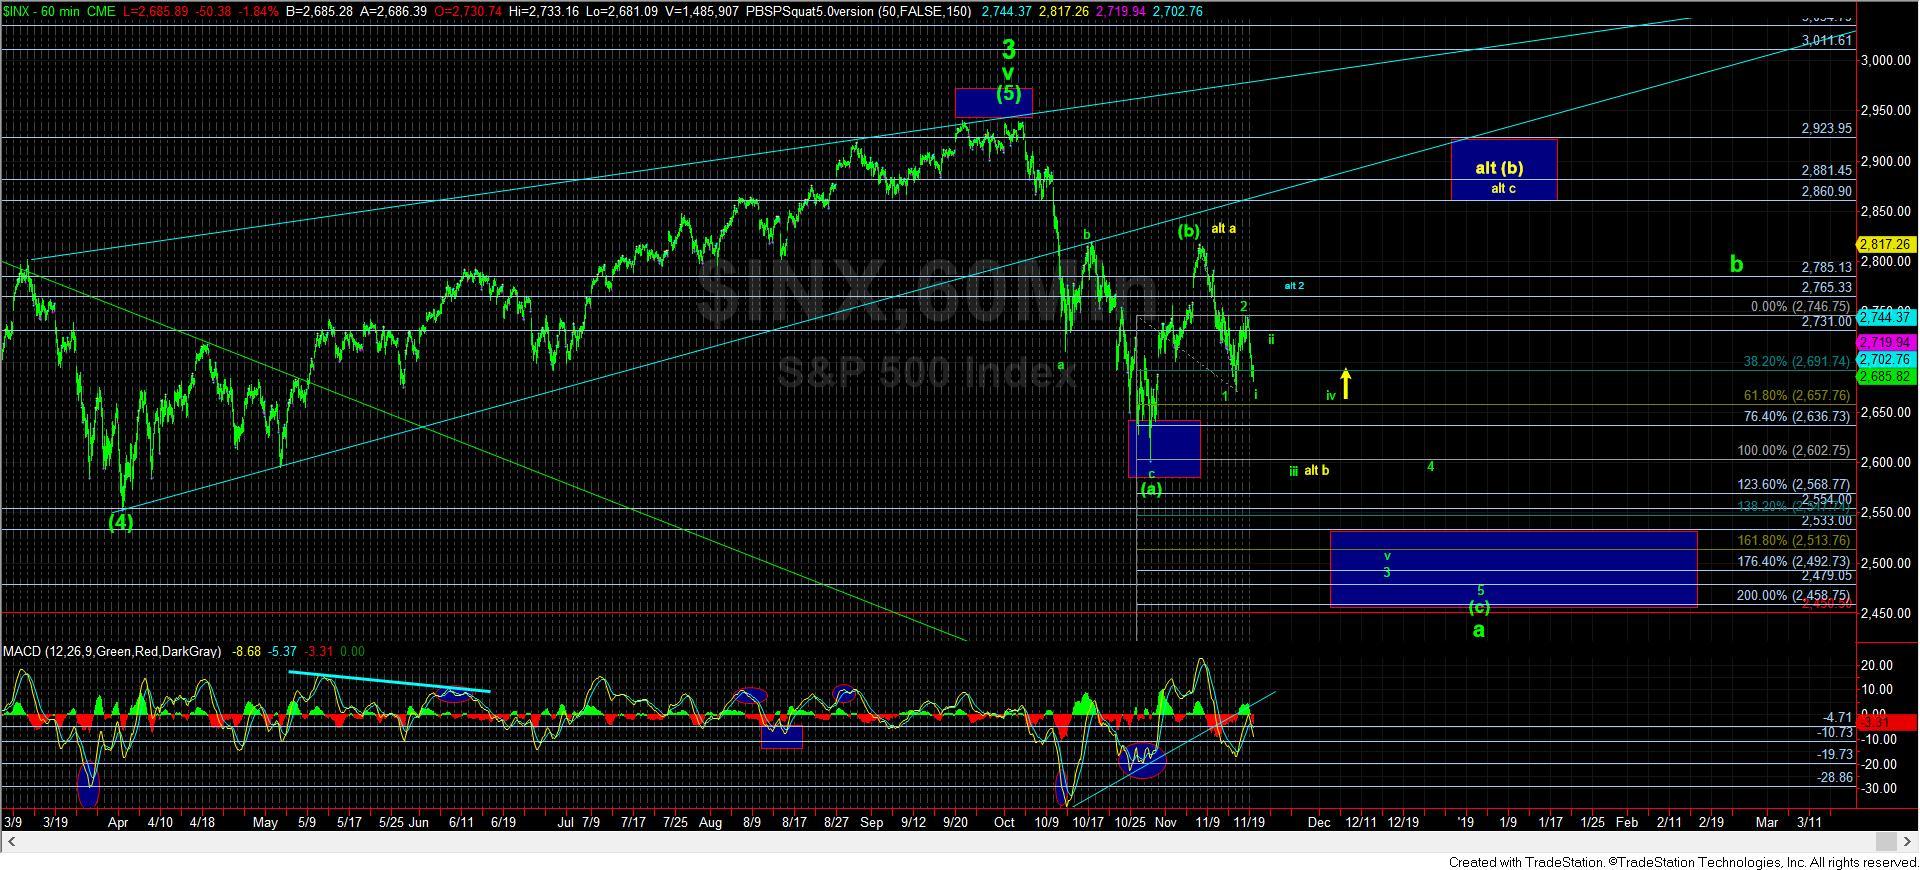
I have moved into a more immediate bearish posture. That means I am viewing the next rally being a wave ii in a bigger move down. I have modified my 60-minute chart to present that. But, I am still going to allow the market to prove it to me otherwise that we can be in the impulsive move higher still - as presented on the attached 5-minute ES chart - but, again, it will have to thread the needle.
Should the next move higher be a CLEAR 5 wave structure to the 2730+ region, then I can still maintain an expectation of the green count to much higher levels. I can also choose to buy longs for that potential on either a wave ii pullback, or on the break out over the high of wave i after wave ii completes (which would be a much safer entry for a long in this market). But, I now see this as a much higher risk since we broke below 2700SPX today, yet, I will maintain an open mind should the market be able to prove this point in the coming day or two.
However, should the rally be corrective in nature, then I am viewing it as a corrective wave ii in green, and as long as we remain below 2731SPX, we are pointing down to the 2600 region again for wave iii of 3, which is the 1.00 extension of waves 1 and 2 in green, and is a standard target for wave iii of 3. Breaking below 2670SPX would likely confirm this potential.
At that point, the market will have to make a decision. Should we bounce off that support correctively, and maintain below the .618 extension down off the green 1-2 (2658SPX region), then it would be a wave iv bounce, and will be pointing us down to the 2500 region for wave v of 3.
Alternatively, if the rally off 2603 is clearly impulsive and moves through 2660SPX, then it again opens the door to rally back up to the 2860SPX region in a larger a-b-c structure for the alt (b) presented in yellow.
The other option on the chart is a move back to 2760-2785SPX, which would be a bigger wave 2 pullback, but still pointing much lower sooner rather than later. We would need to move strongly through 2731SPX to even begin to consider this potential. While, I have no evidence for this potential right now, I put it on the chart because it is sitting in the back of my mind for now, and I just wanted to put it out there.
So, the question is how one trades this. Well, if the next rally is clearly a corrective rally and we get back up towards the 2720-30SPX region, you can attempt a short trade if you wish, with stops just over 2731SPX. You should have two targets in mind – one at 2603, and the other at 2530.
Another way one could trade this is to allow the i-ii to play out in the coming day, and buy the break down below the wave i, should it occur. Again, you would have two targets . . one being 2603, the other being 2530. And, again, a break down below 2670SPX would likely confirm the next target in the 2600 region again.
As I said over the weekend, investors are playing with fire, especially trying to trade the long side. The market is likely within a 4th wave, and they are quite variable and treacherous in nature. So, you have to always be on your toes, and likely maintain capital preservation as your primary focus. While you can attempt trade set ups as they present themselves, you need to have strict risk management rules in place, such as stops and smaller position sizing.
Again, I still believe the market as a date with much lower levels as we look towards 2019. But, the path will always be a question during a 4th wave, as they are so variable in nature.
I am not sure there is much more for me to say at this point, but simply to reiterate how treacherous 4th waves are. As I have said many times before, those attempting to trade aggressively within 4th waves often find themselves in a position of losing a lot of the profits they earned during the prior 3rd wave rally. It is for this reason I continually reiterate a focus on capital preservation, which will allow you to maintain your profits to redeploy when we approach the conclusion of this 4th wave at much lower levels. Moreover, as part of that preservation of capital, to the extent you choose to trade within a 4th wave, you must reduce your position sizing, and use stops.
While you will still likely be stopped out several times during 4th wave whipsaw (it is simply inevitable), it is still better than the alternative. Consider the power of understanding the context of the market, and being able to adjust appropriately. This is one of the more powerful perspectives gleaned from Elliott Wave analysis, and it really puts you in a different league when managing your own account.