More Of The Same
I wish I had more insight to provide tonight, but the market has chosen to go sideways for yet another day.
There is one more point I would like to add, which was posted during the day today:
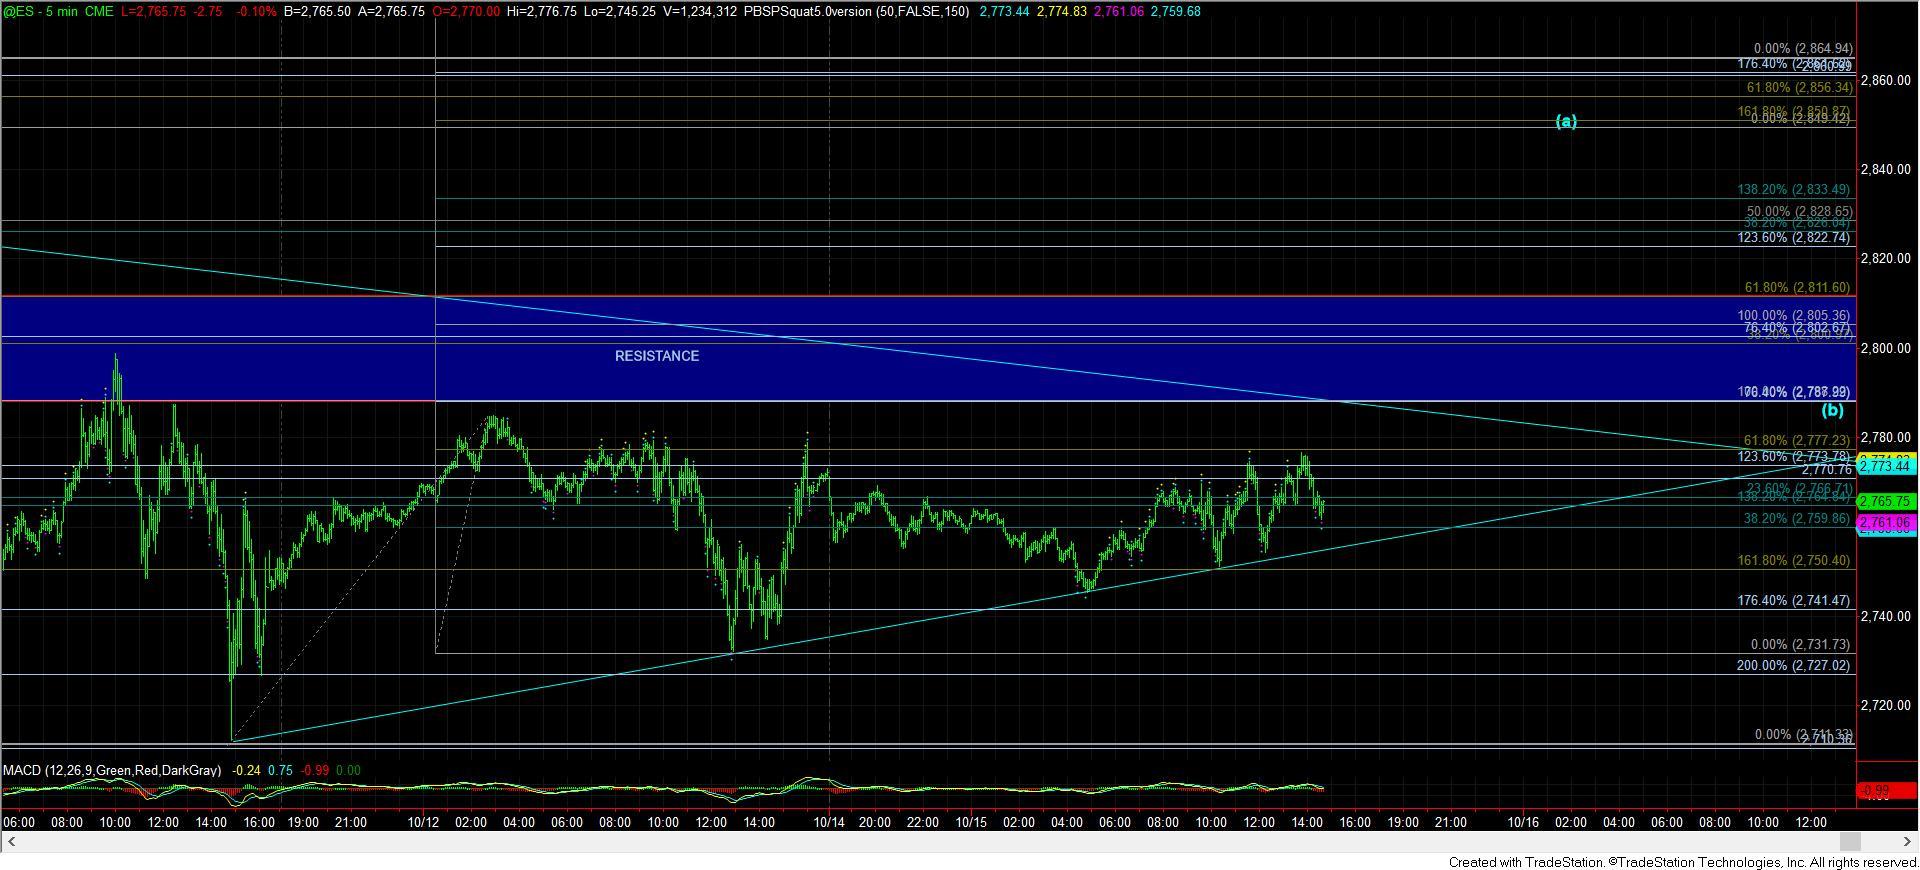
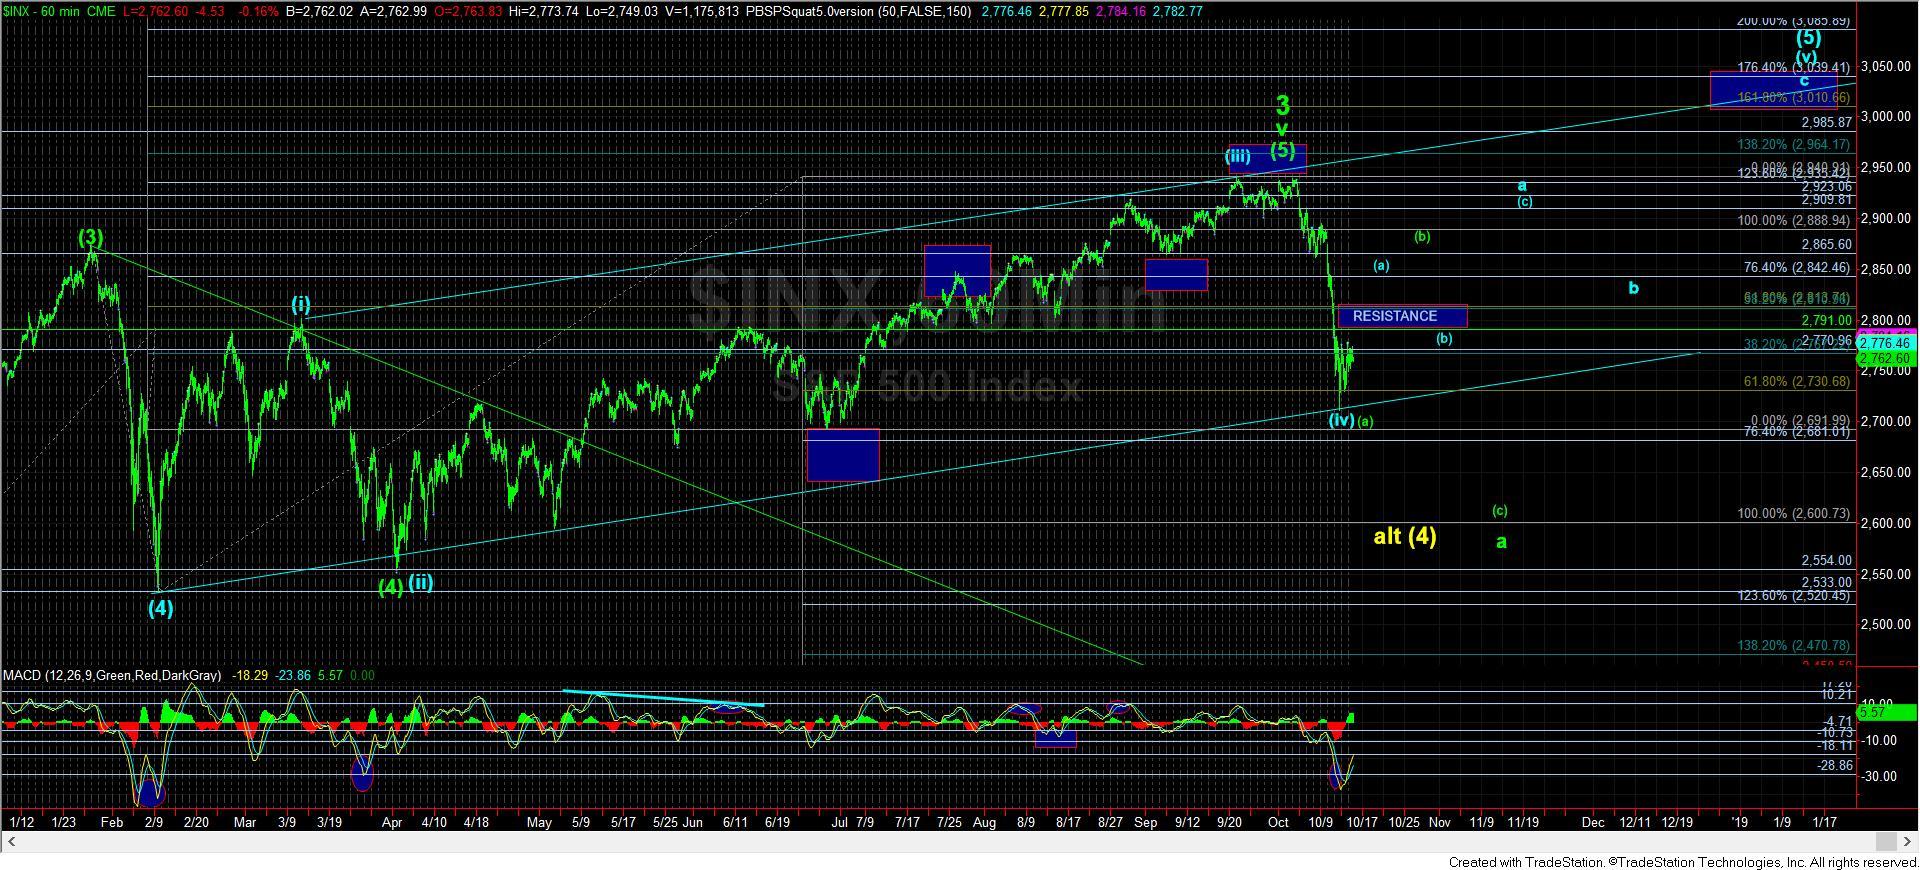
I want to add a point that many may not have realized about my alt (4) count in yellow. The only way I can even consider the potential of that yellow count is if this is really a 5 wave drop down to the 2600 region where a=c in the bigger flat perspective. That means we must see a follow through drop from below resistance taking us down to the 2600SPX region. Otherwise, any (a)(b)(c) structure, as shown in green on the 60-minute chart now would make it more of a WXY, and a much less reliable potential for a wave (4). Rather, that would make the larger degree wave 4 being in progress a much higher likelihood.
So, still waiting on the market to tip its hand. Below resistance, I am still looking for a direct drop ideally to 2600 region, but we need to break down below 2680SPX support to get us there. Over resistance, and we will have two scenarios to deal with . . blue and green.
The ONLY way I will even consider the blue structure is if we pullback correctively and hold the blue (b) at the resistance region, and develop a micro 5 wave rally off it for wave i of the (c) wave of the a-wave of the (v) of (5) in the ED. That is a lot to ask and a low probability based upon where we stand today.
So, again, as long as we remain below resistance on the ES chart, the next support lower in the SPX is the 2680/90 region, followed by 2600SPX.
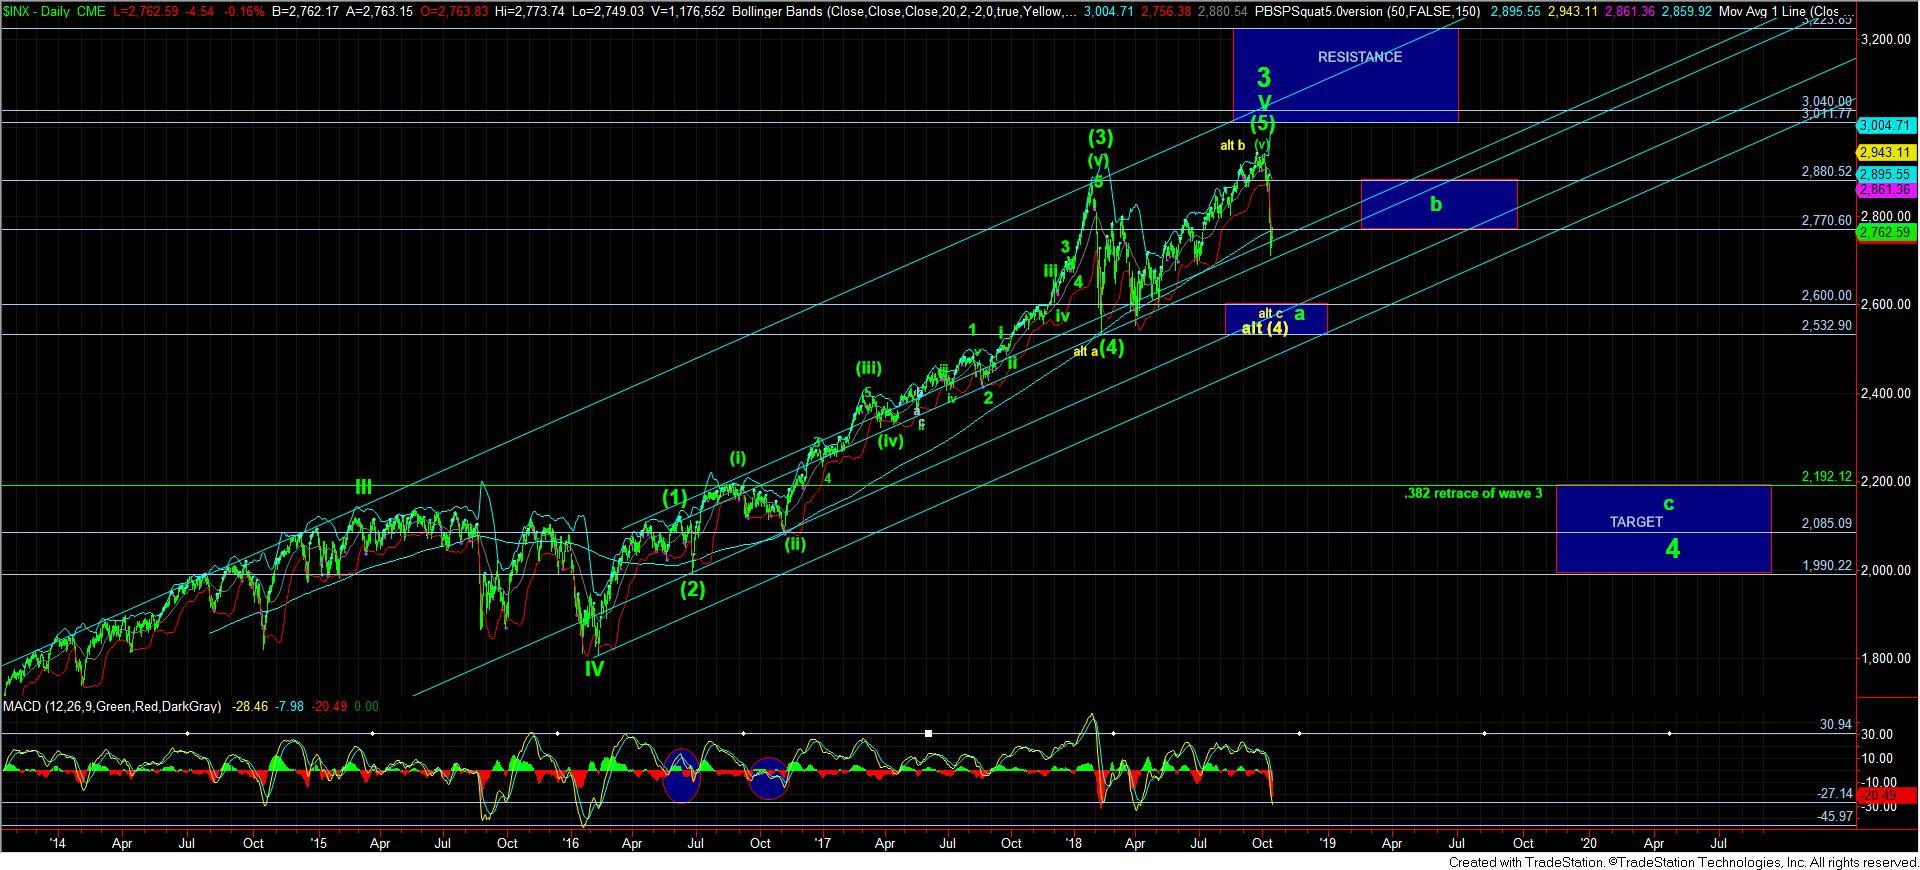
And, the only way I can even consider the yellow count is if we see a direct drop to the 2600SPX region. Otherwise, should we go up, it can either be the green (b) wave of the a-wave of wave 4, or the ending diagonal 5th wave, outlined in blue. But, remember, for us to even consider the ending diagonal, after the rally over resistance, the blue (b) wave pullback into that resistance must hold support and begin an impulsive structure back up towards the prior highs to even consider the potential for the ending diagonal to 3000 still. For now, that is truly a lower probability on my radar screen, at least as long as we are below resistance.
Moreover, as I noted on the weekend, I think the risks have risen to the point that I would consider trading for that 5th wave of an ending diagonal to be such that I would not suggest it. Should it occur, it would only prolong the eventual decline to the 2600SPX region once it completed.
So, as I have been warning for the last month, especially once we broke below 2880SPX, the risks of certainly risen on the long side, and the weight of evidence is shifting us towards the 4th wave.