More Grinding Action - Market Analysis for Mar 18th, 2019
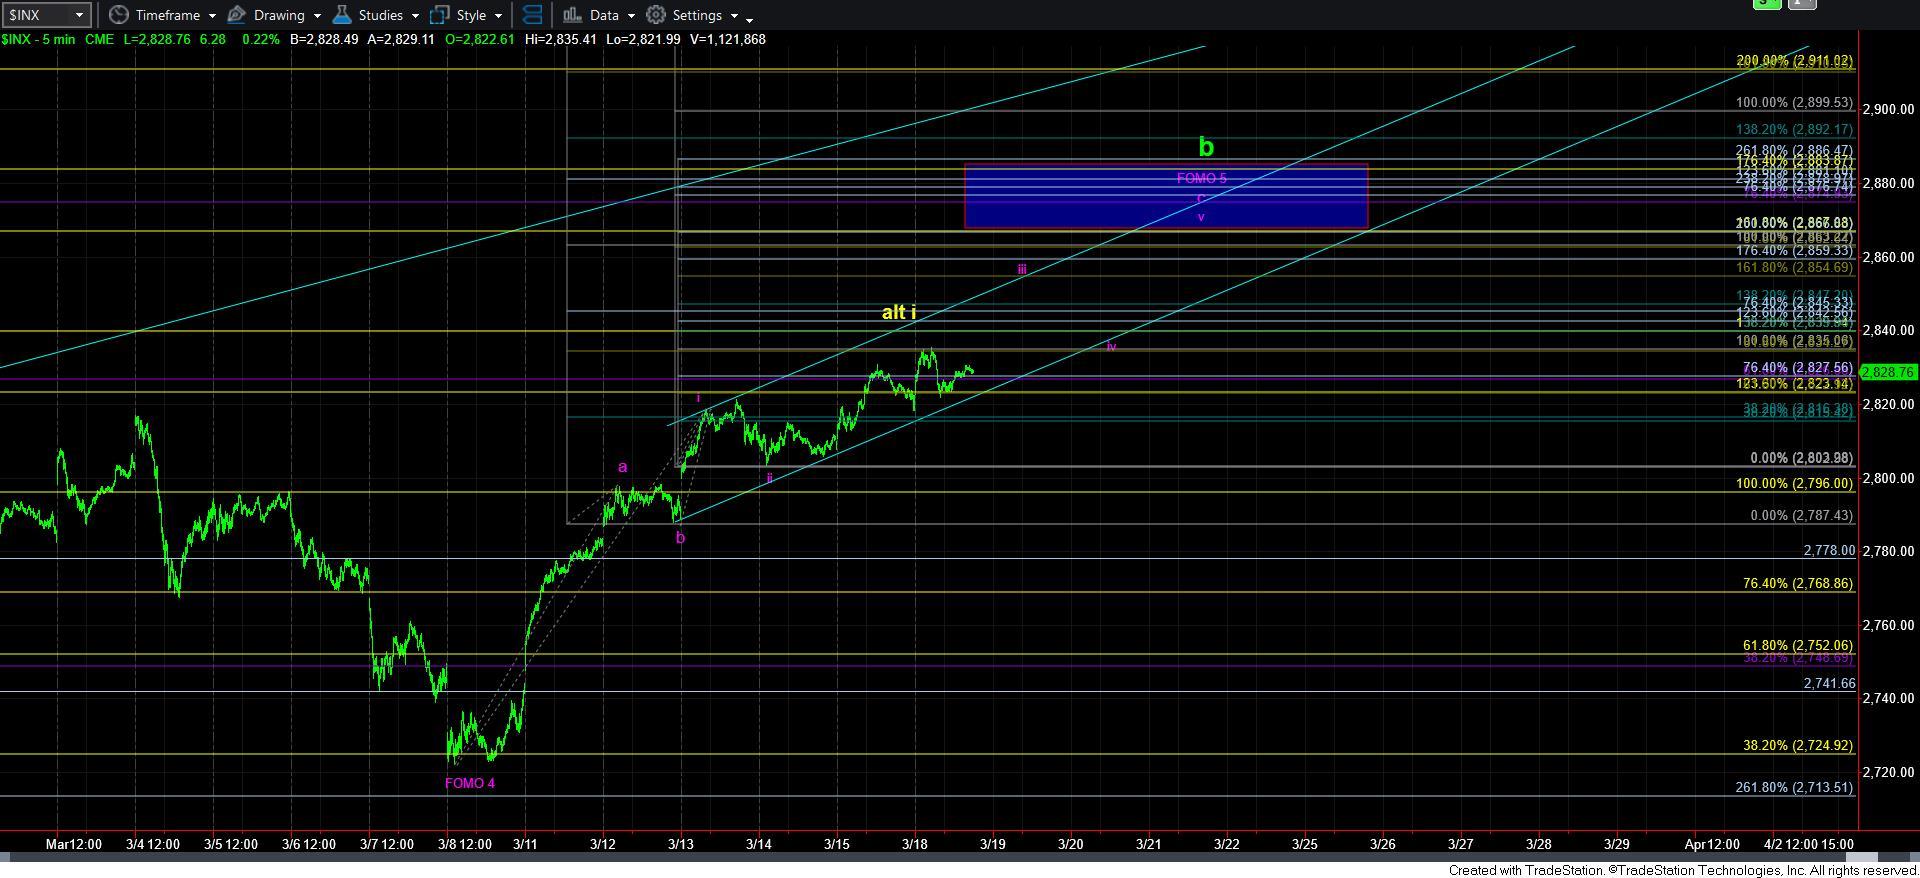
I cannot say that I have much more to offer since the weekend update. The question still remains as to whether the market can continue to push higher towards the 2867-86 region on the S&P 500 (SPX), as shown on the 5-minute chart.
Most specifically, if the market is completing 5 waves up off the 2725 SPX region, then we will really not exceed the 2840 region, whereas a move up towards 2850 within the next day or so would suggest that we can still extend up towards our ideal target for this b-wave rally.
And, just to repeat what I noted last week, this is why I think there could be a difference if we top out below 2840 on the SPX:
For those that are just learning Elliott Wave, you will learn that we view the market as fractal in nature, which means that it is variably self-similar at different degrees of trend. That is why 5-wave structures seen at all degrees provide strong evidence as to where we are in the wave count.
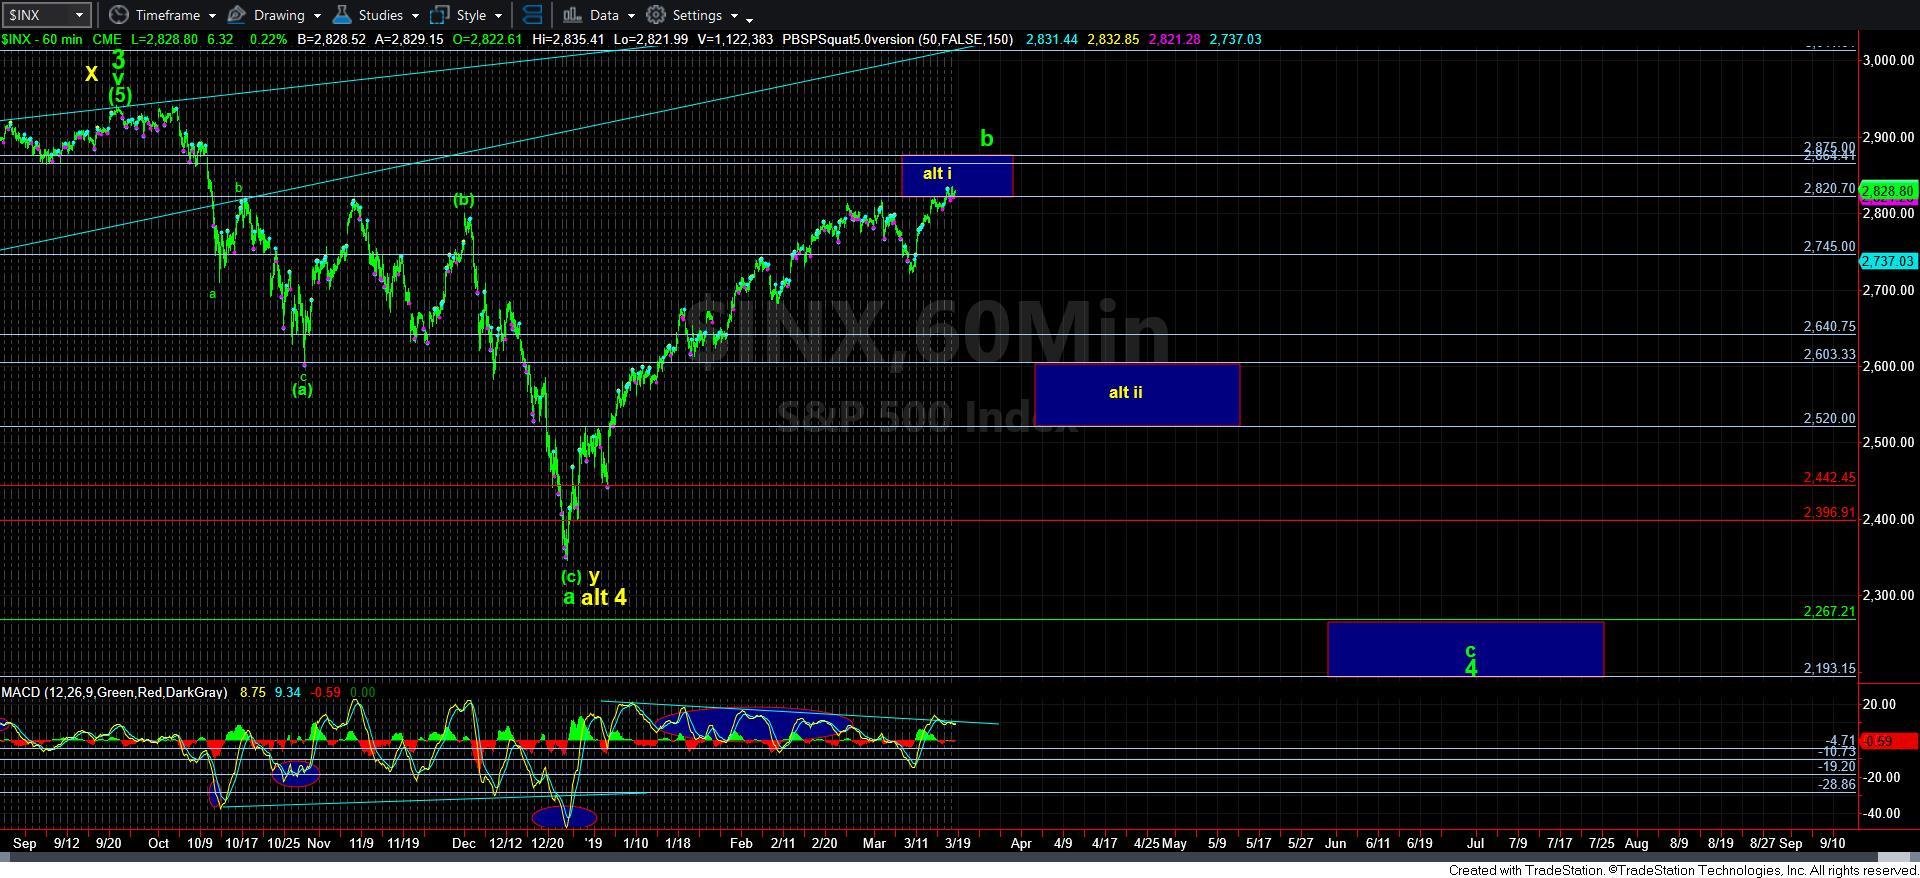
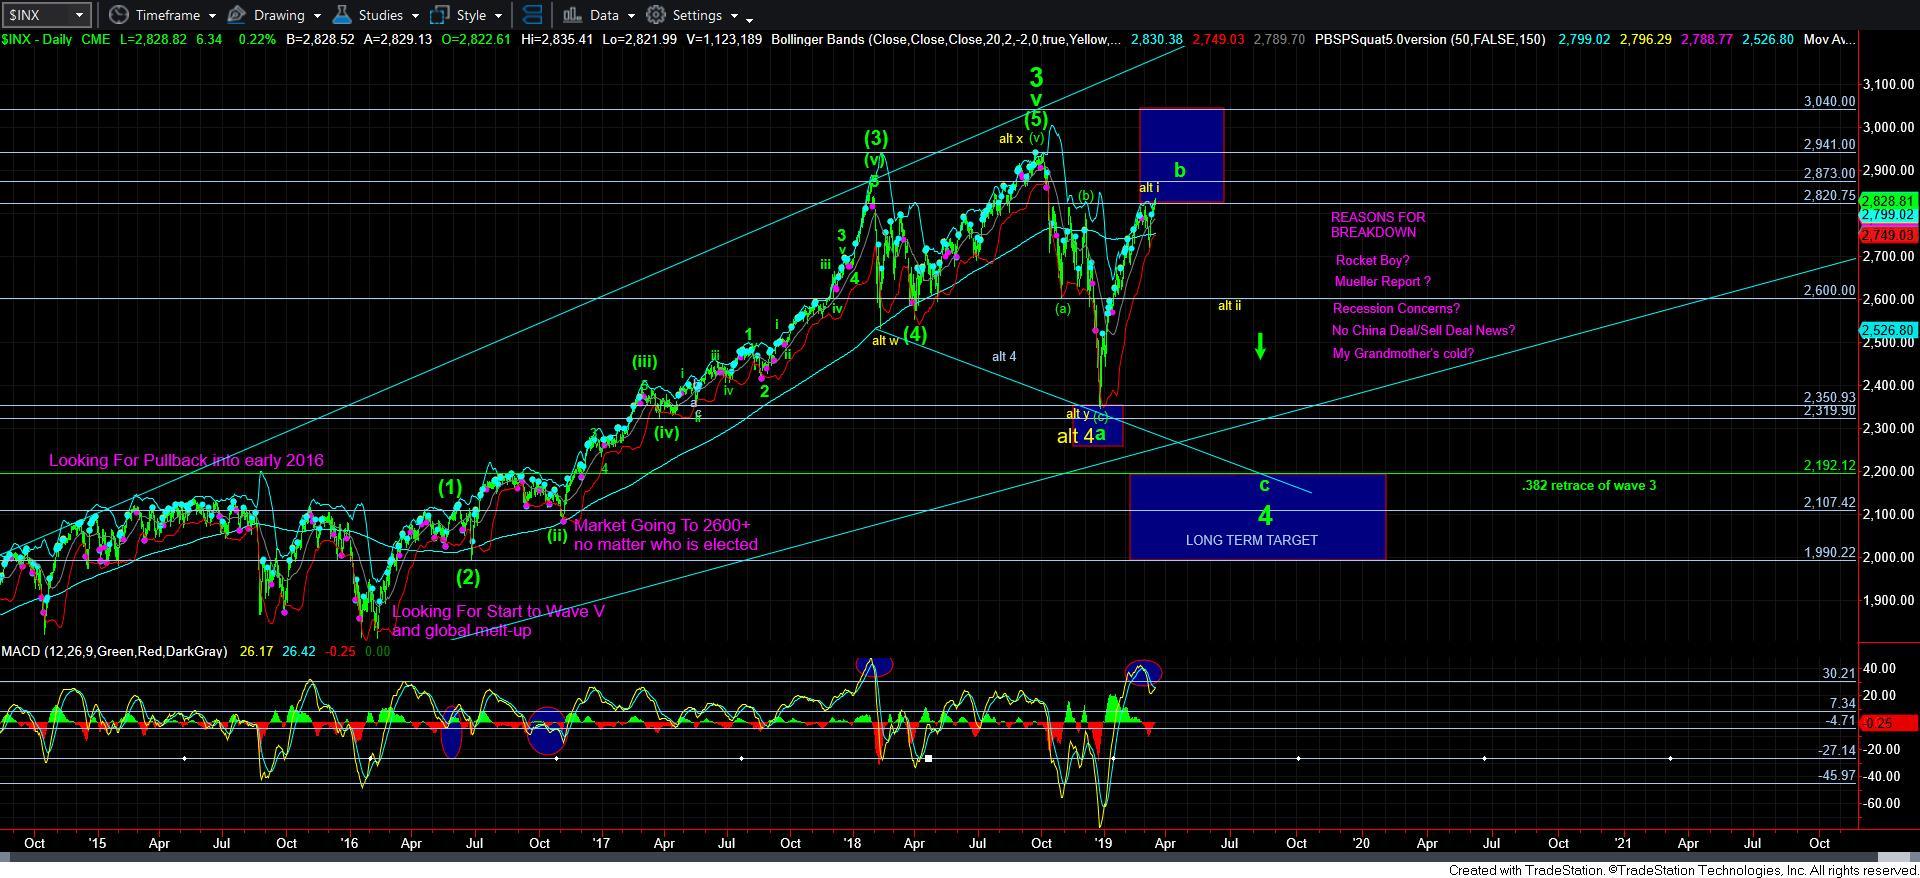
On Friday, I noted that if the market tops out in the 2840SPX region, and is unable to continue towards the 2860-75SPX region, it could mean that the yellow count may ultimately take its place as the primary count in the next month or so. So, allow me to explain why I would even say that up here.
Our primary count has this last leg up in the SPX counted as an ending diagonal for this [c] wave of the b-wave rally. That means that substructures should count as 3-wave a-b-c movements. So, in order to complete this 5th wave of an ending diagonal, we need to see an a-b-c structure, with the appropriate proportions exhibited within the a-b-c structure. But, would suggest that the market rally to at least the 2860SPX region in order to see those proportions within this 5-wave of an ending diagonal.
However, should the market top out near the 2840SPX region, then all we can reasonably count off the 2725SPX bottom we recent struck is 5 waves up. That would suggest that we may have completed an impulsive structure off the December lows, and would give a bit more credence to the yellow wave i topping count. While the rest of the rally has not really provided us with a clear substructure on the way up, I am hard pressed to be able to identify how this b-wave can top out with a 5-wave structure based upon the rally from the 2600 region.
Of course, I can certainly reverse engineer a count that would make sense, but I don’t think that to be the most honest way to approach this count. Rather, I would have to consider completing this rally with a 5-wave structure as being another piece of evidence for the yellow count as opposed to the green count. That makes the manner in which we drop from this region that much more important in the coming weeks.
So, as I have outlined the evidence for the green count being more weighty over the past week, should we top below 2840SPX, then that would certainly give us some evidence towards the yellow count, and, as I just said, the manner in which we decline towards 2600SPX will become of utmost importance.


