More Evidence Of Bottoming
I am not going to be reviewing anything too micro today. So, I am going to discuss the 60-minute and daily chart of IWM as well as the 60-minute and 5-minute chart of the SPX.
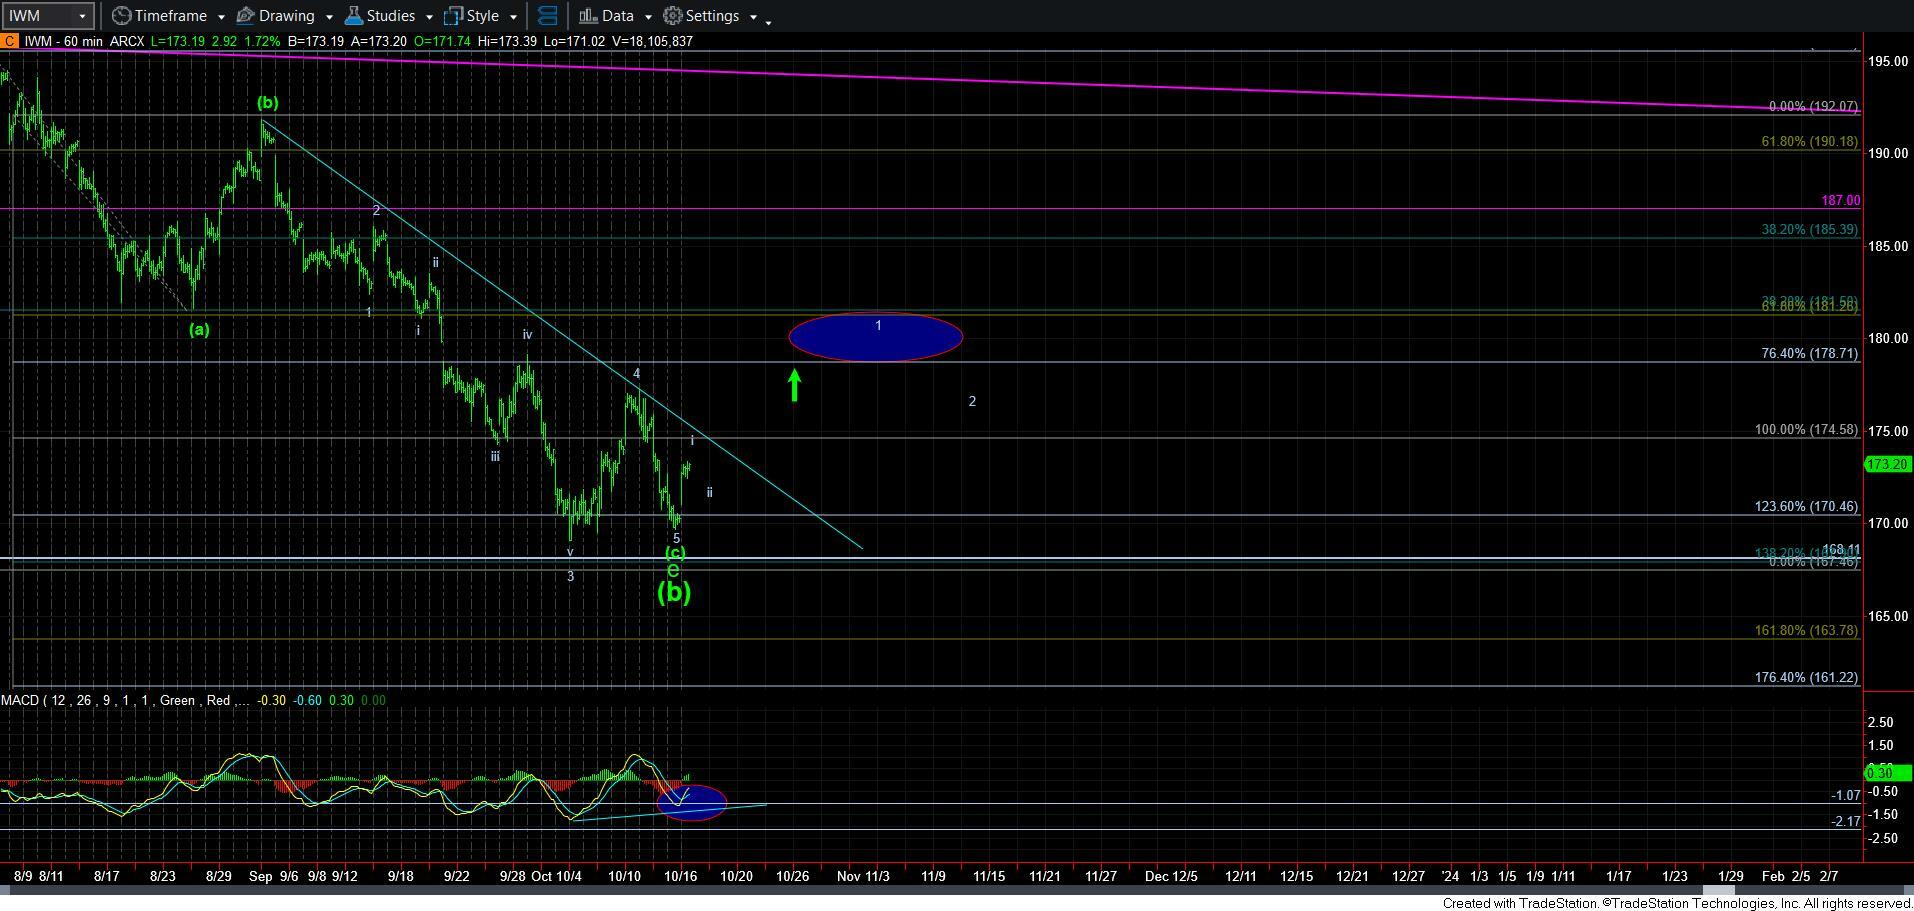
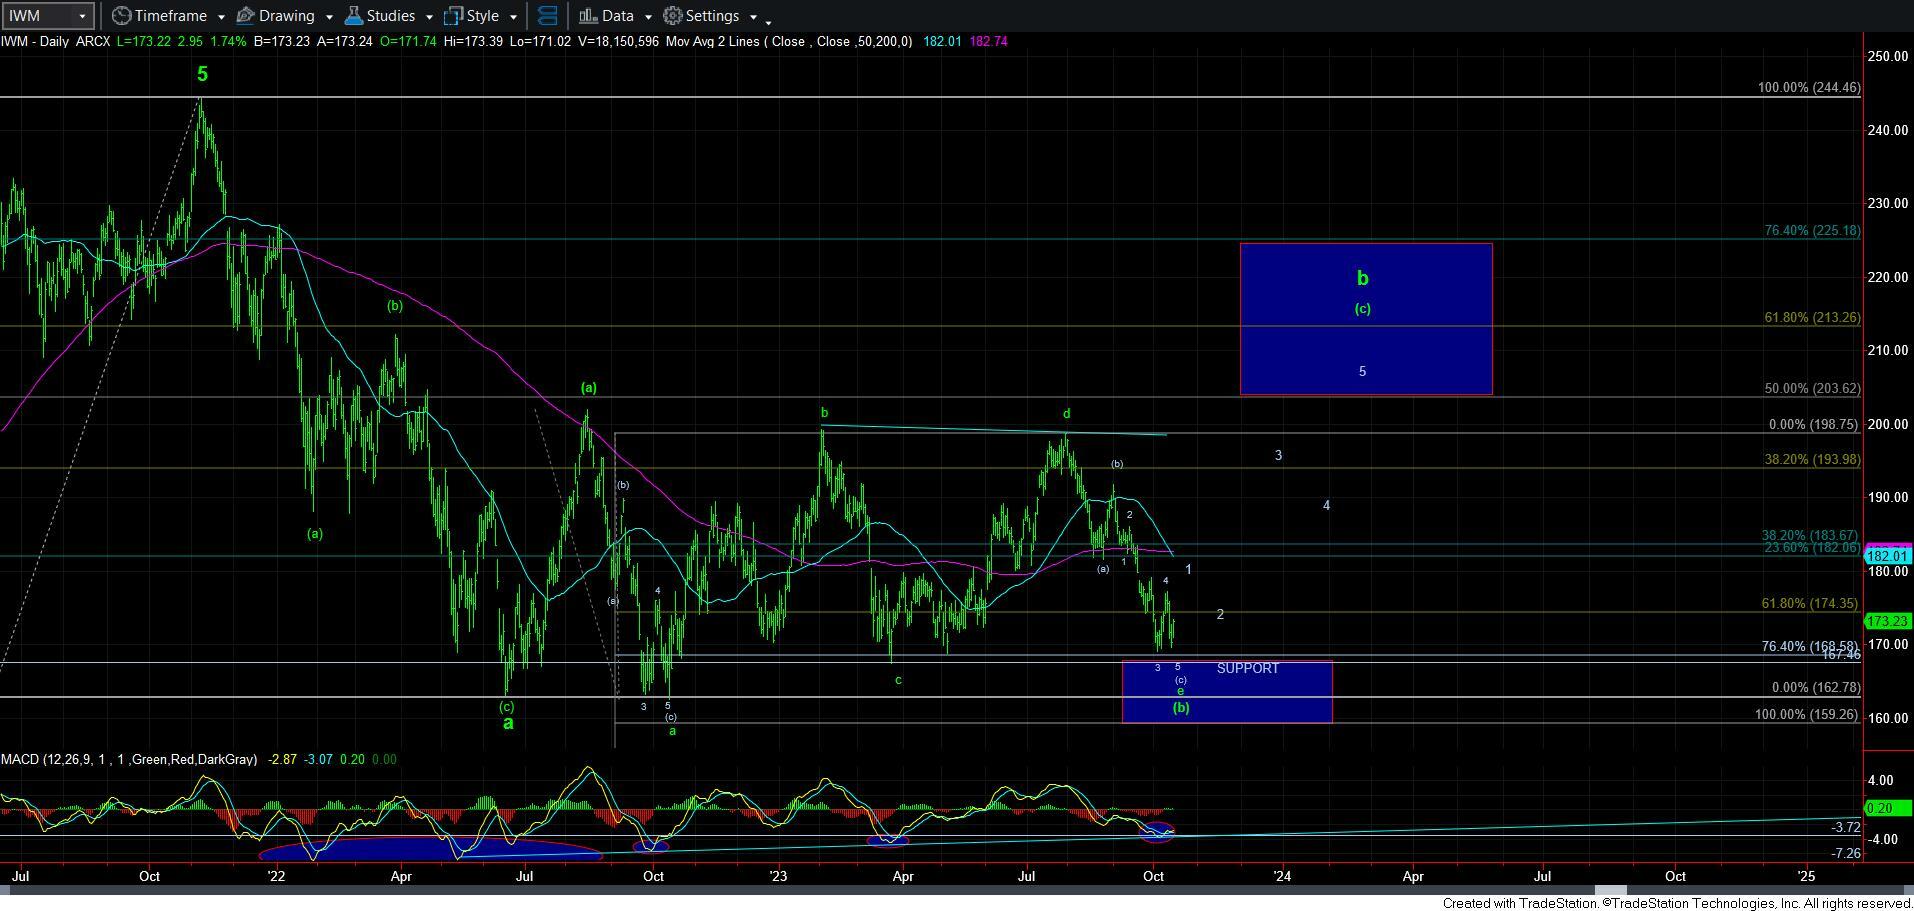
Let’s start with IWM. As we can see, the divergences on the daily chart have been building even stronger. And, this is allowing me to get a bit more confident that we are bottoming in IWM. Moreover, we can now see that the MACD on the 60-minute chart has turned up as well, which also supports the “bottoming” perspective.
But, the only way to consider the bottom as being struck from a wave-count perspective is with a truncated 5th wave low. And, they are not always terribly reliable. So, if you want to have more confidence in a rally in IWM to 200+, then I would suggest you wait until we get the larger degree 1-2 structure outlined on the 60minute chart.
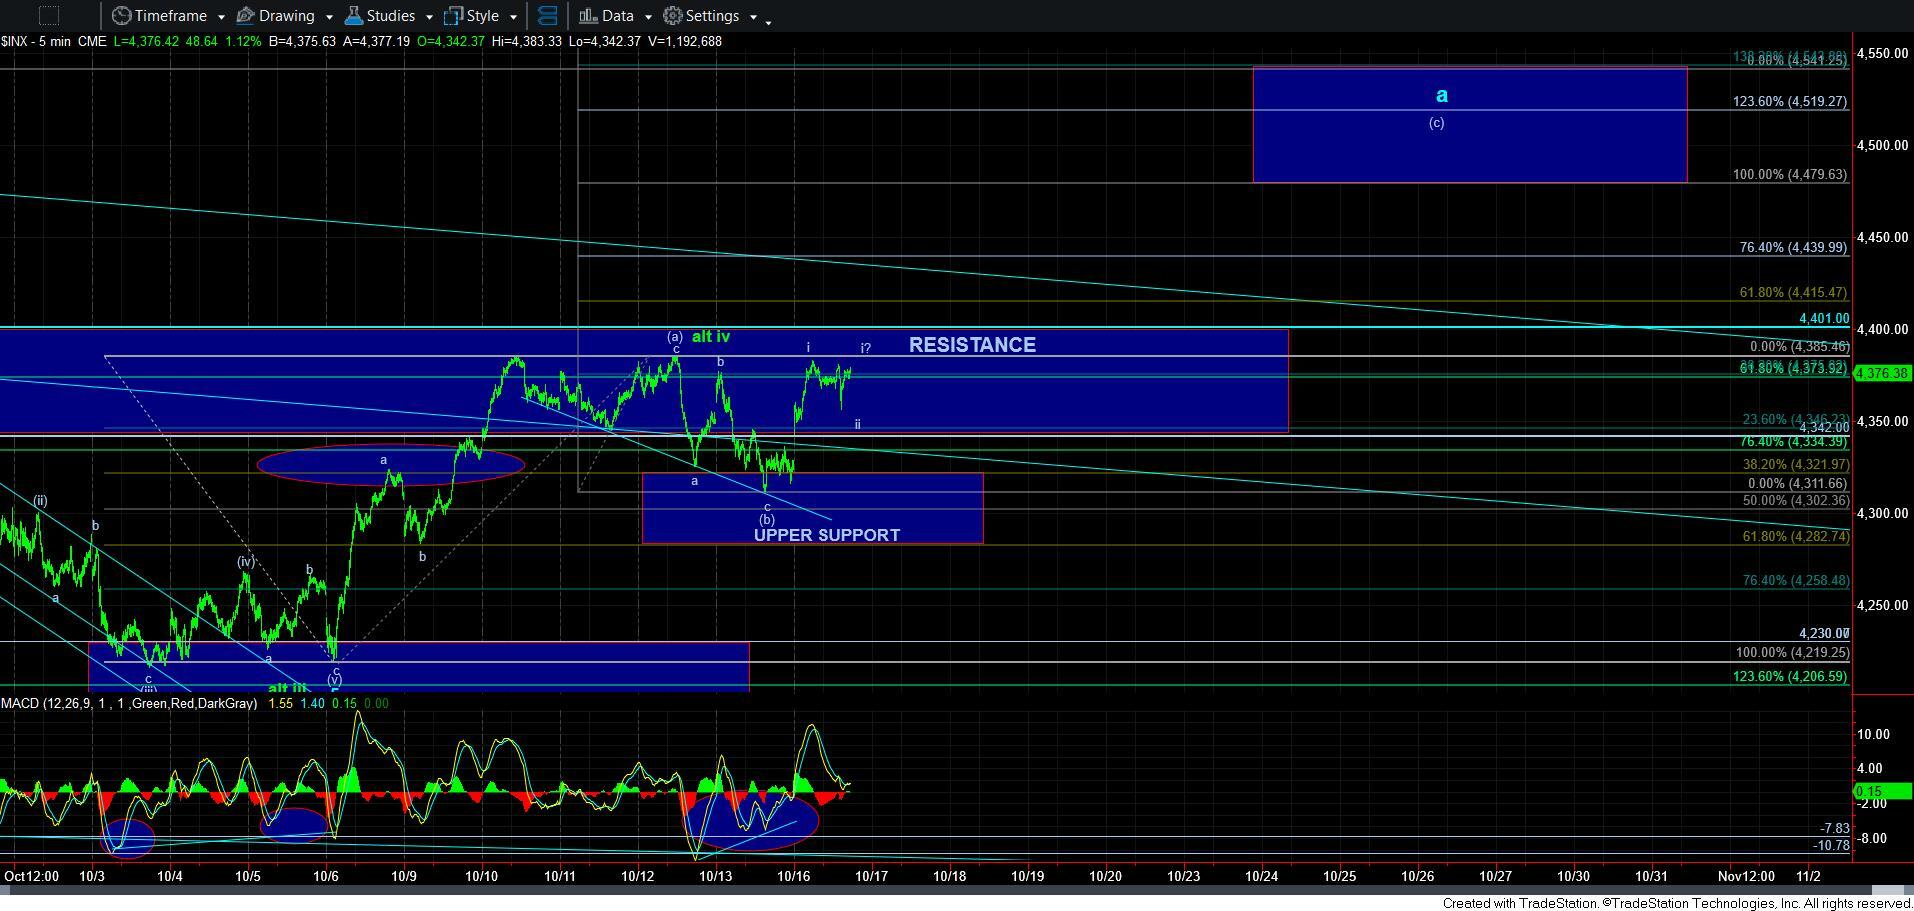
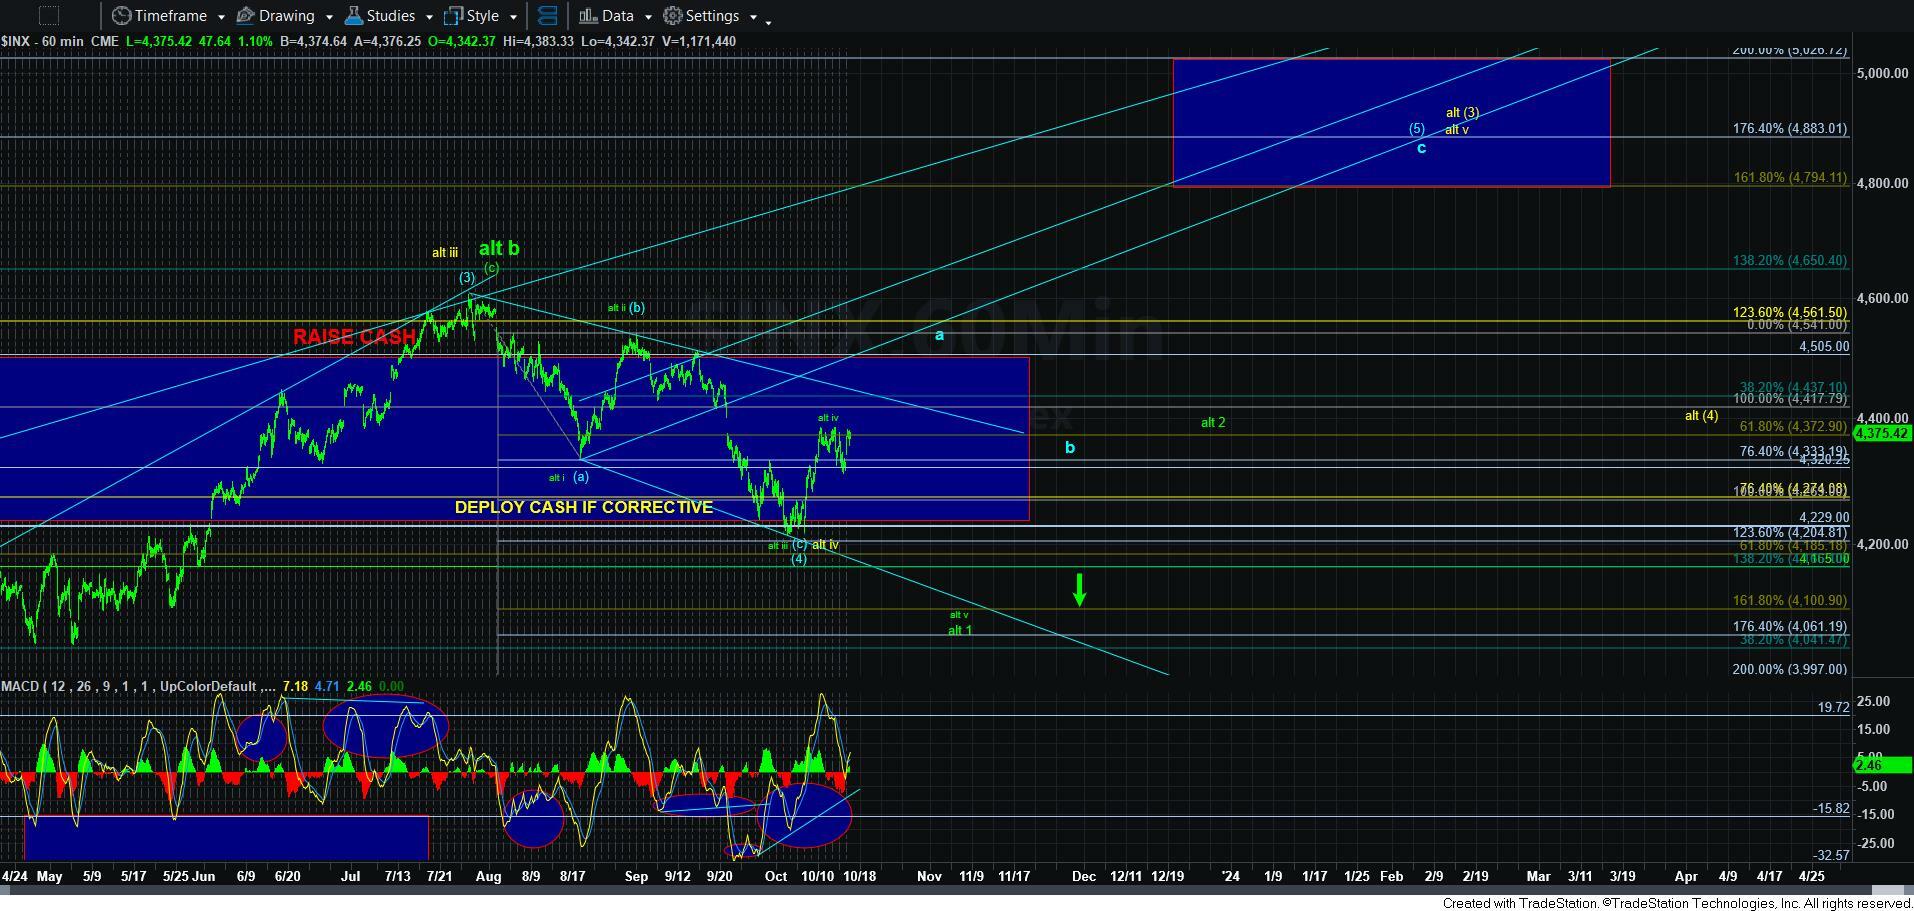
As far as the SPX, we have enough waves in place to consider all of the [b] wave as complete. In fact, we have enough waves to consider wave i of the [c] wave rally as complete. But, to be honest, I would prefer a bit higher for a better wave i. So, should we get over today’s high, it makes it much more likely that a bottom is in place for the [b] wave, and that the [c] wave rally is in progress. And, if you remember, that [c] wave will likely point us back up towards the early summer high, and complete a larger a-wave, as can be seen on the 60-minute chart.
Now, can the market still drop again into the Upper Support region for a lower low in the [b] wave? Sure. But, due to how high we have come today, it makes it likely that we will hold that support. But, due to us seeing 3 waves down off today’s high, it makes it much less likely that we will get a lower low into that support right now.
So, at this time, we have developing evidence that a low of sorts was struck on Friday. And, once the market breaks out through the 4401SPX region, then I think it is likely that we will rally back up towards the early summer highs to complete the a-wave outlined on the 60-minute chart. I would then expect another pullback before we see a sustained break out over 4607SPX, as shown by the b-wave on the 60-mintue chart.