More Cracks In The Armor
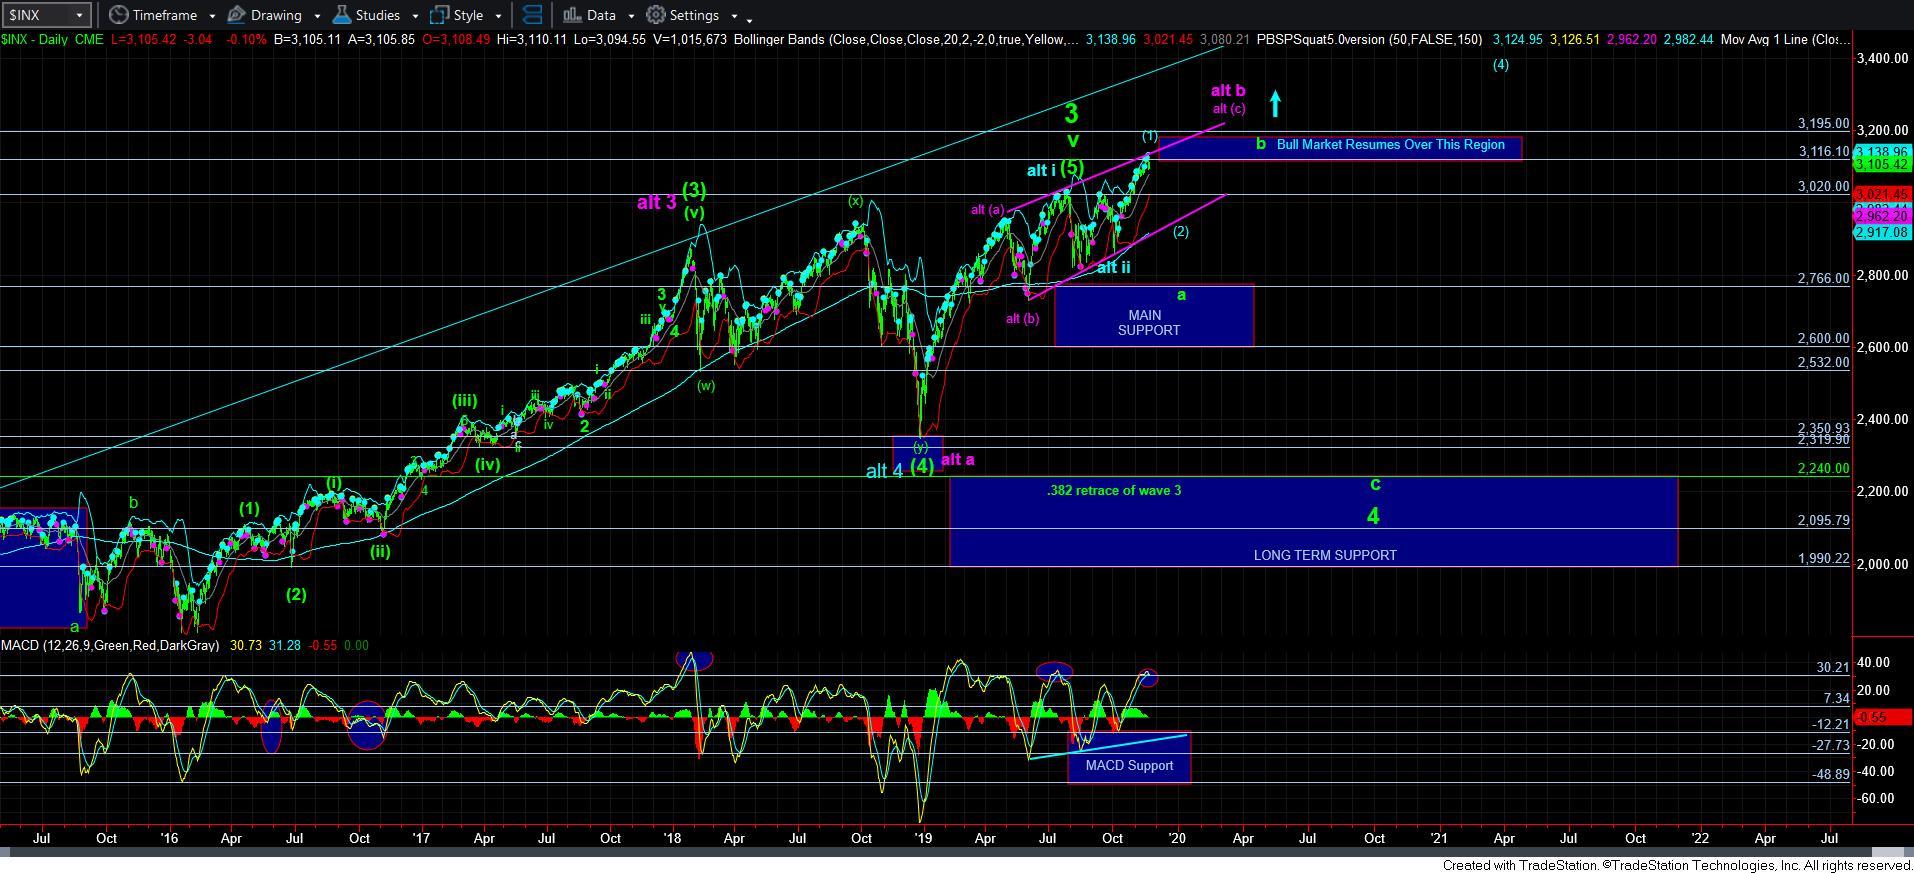
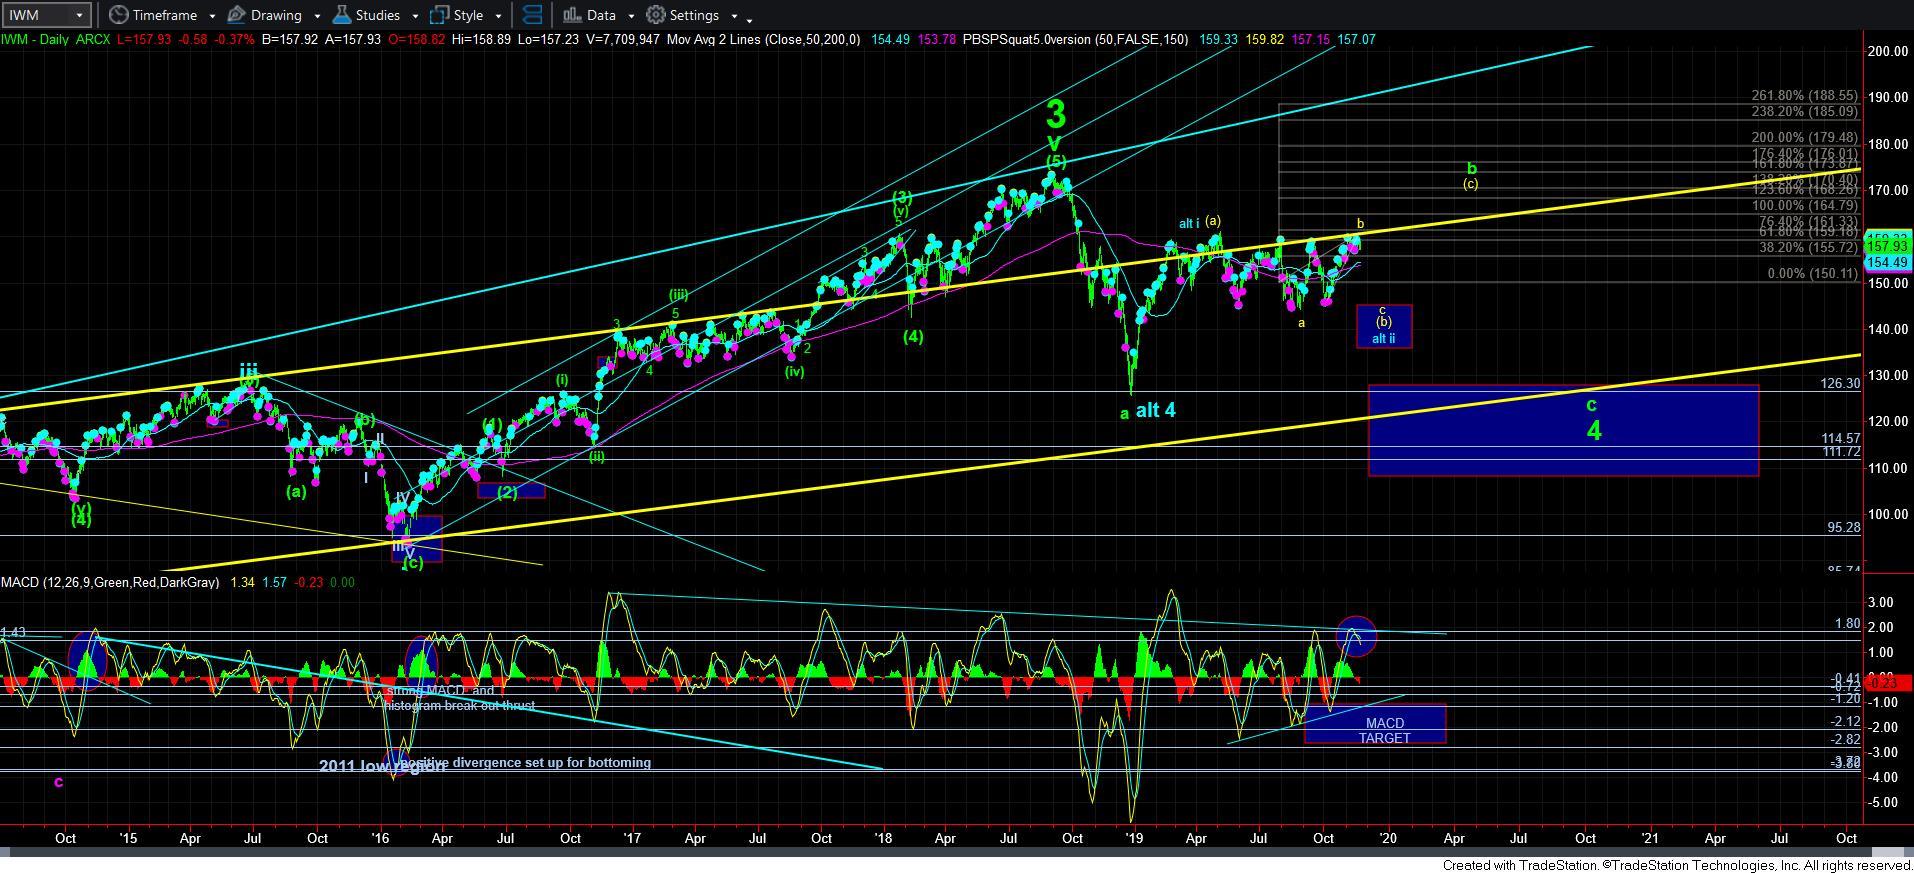
With today’s “consolidation,” the most interesting thing that has happened is that the MACD on the daily SPX chart finally crossed negative. While the daily IWM chart had already seen this occur last week, it has now begun in a downtrend.
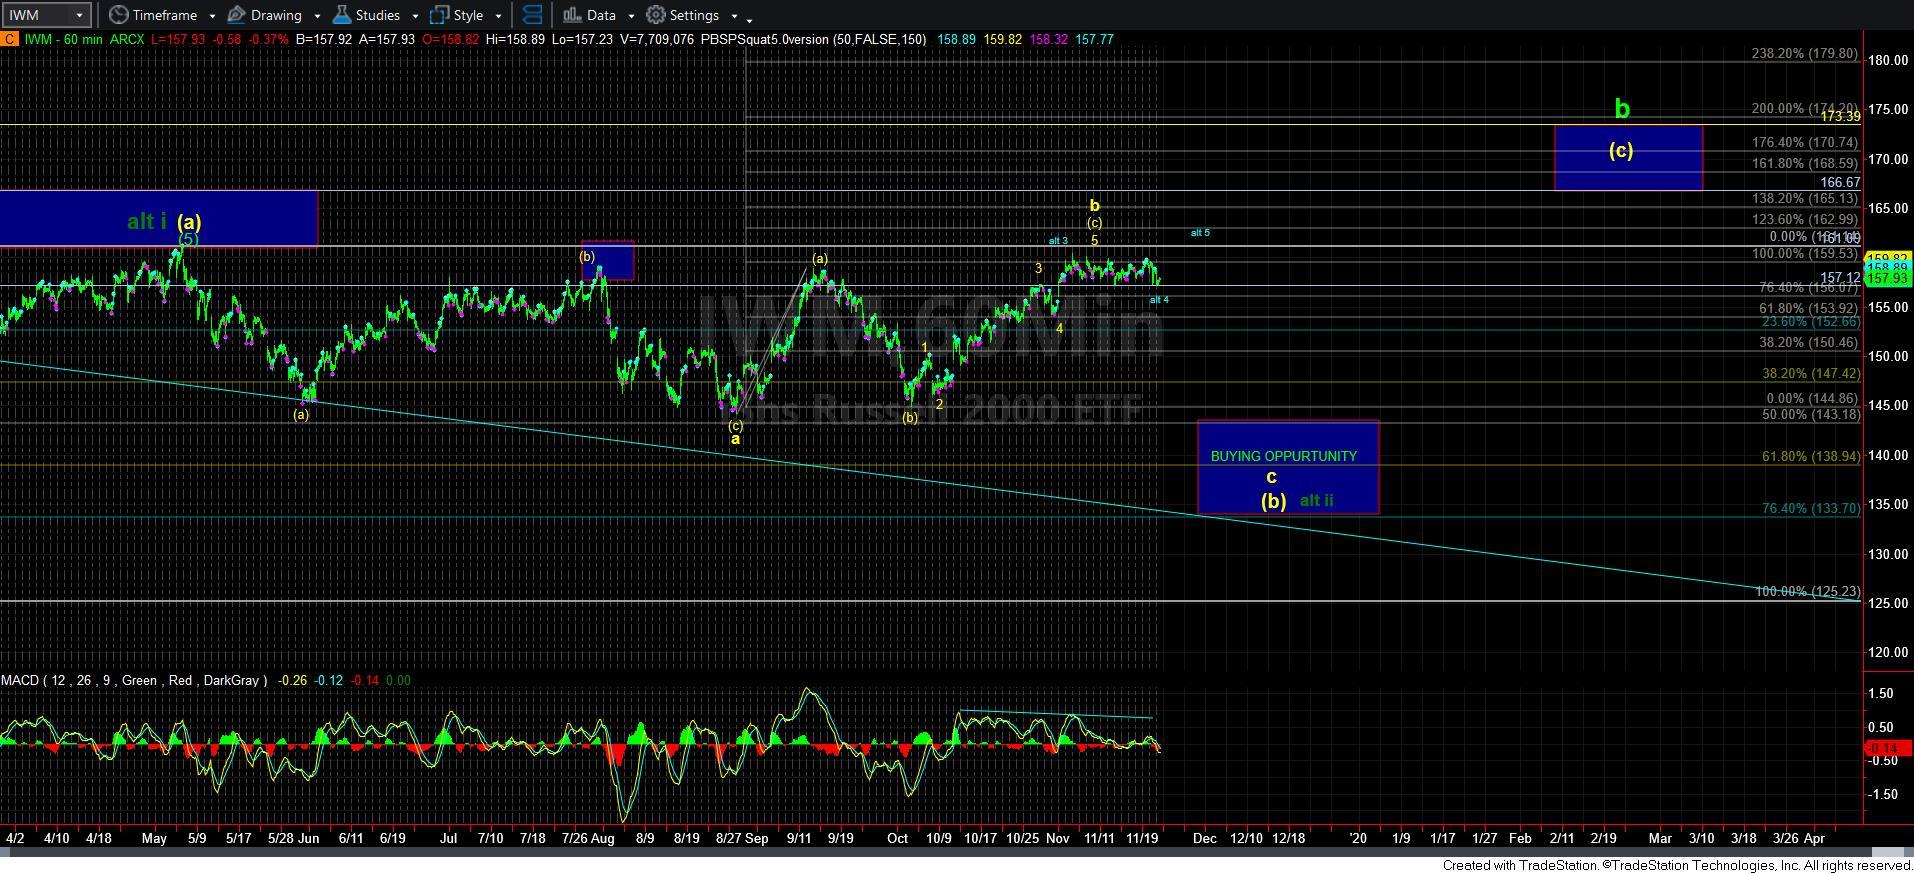
While this is a clear indication of the lack of upside momentum, it does not prevent the markets from making one more higher price high on negative divergence in this indicator. And, you can see that potential best on the 60-minute IWM if we are unable to break down below the 157 region soon.
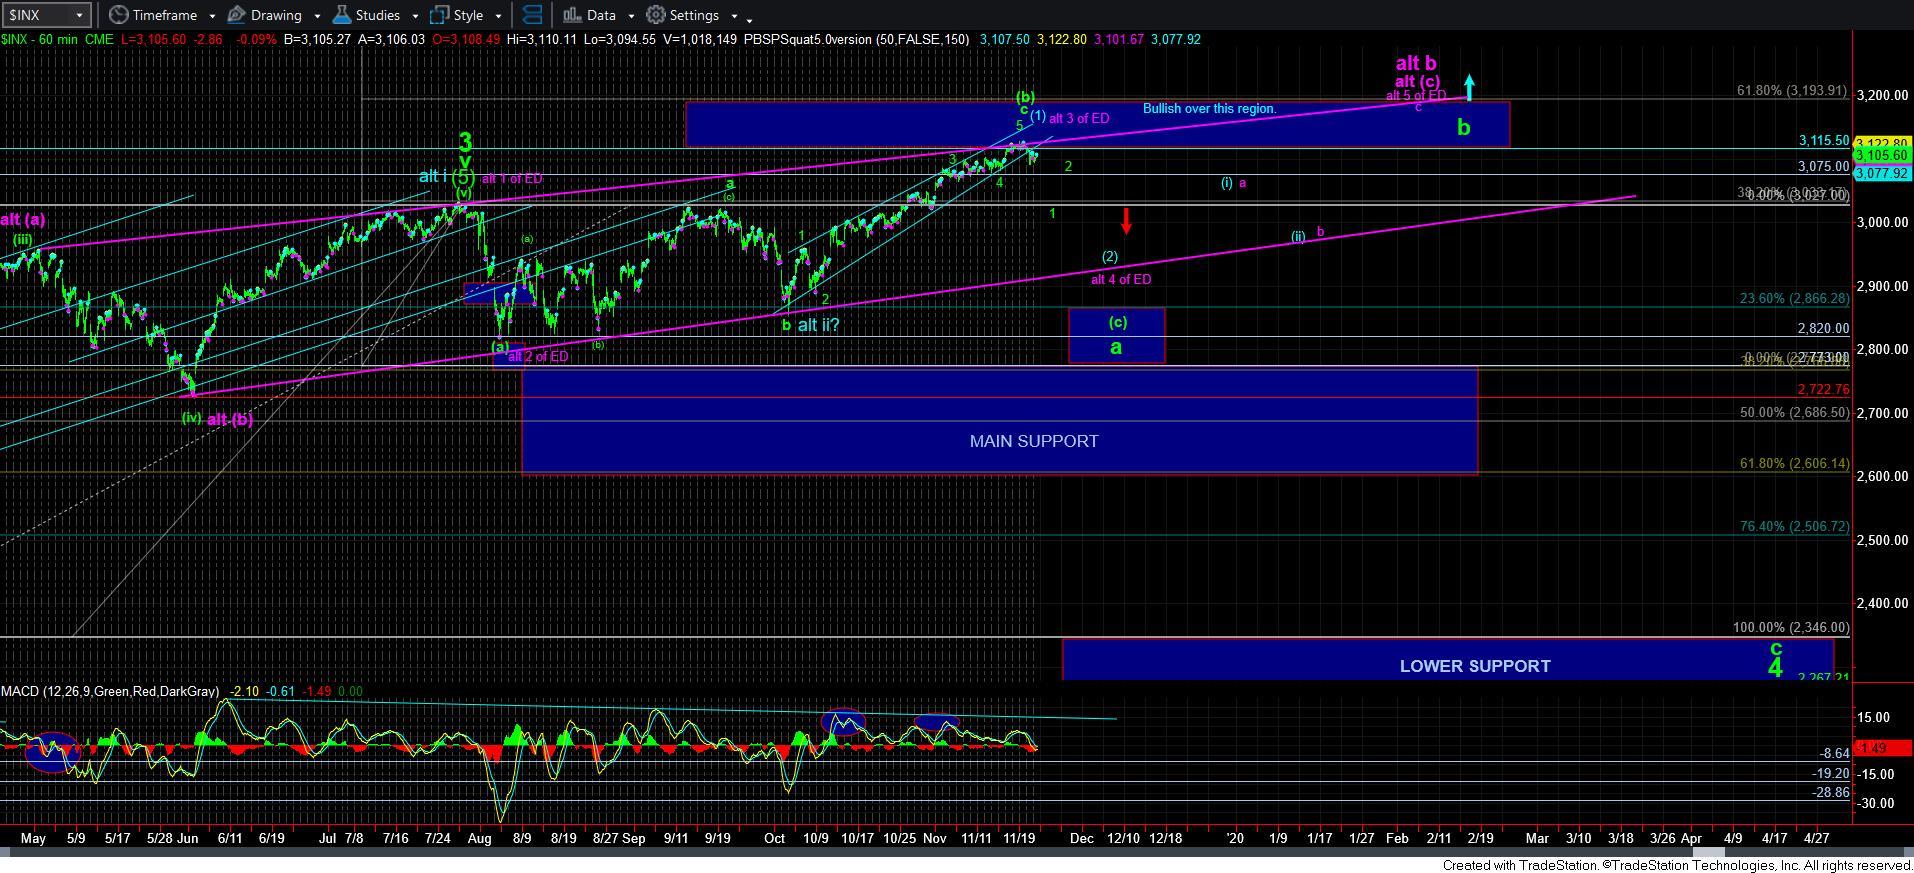
This is why I have been noting that we will need to break down below the 3070/75SPX region to confirm that a top has likely been struck. Once that occurs, the MACD on the daily SPX chart will also likely be within a downtrend, and price will begin to confirm that as well.
On the micro structure, as long as the futures remains below 3118ES, then we have a set up in place to break below the next lower support region. In fact, should that break down take us towards the 3020/30 region and complete a larger degree 5-wave structure, I will count that as green wave 1 down, as shown on my 60-minute SPX chart. That will allow me to maintain my expectations for the [c] wave of the green a-wave down towards our target box below.
However, if the market is unable to complete 5-waves down towards the 3020/30 region, then the probabilities for the blue/purple scenarios become higher, and it makes it more likely that we will not break down below the uptrend channel.
In summary, I still need the follow through below 3070 to provide us with confirmation that a top has been struck, and the manner in which we drop towards the next lower support in the 3020/30 region will provide us with stronger indications as to how deep the impending drop can take us.