Mixed Signals Off The Recent Highs
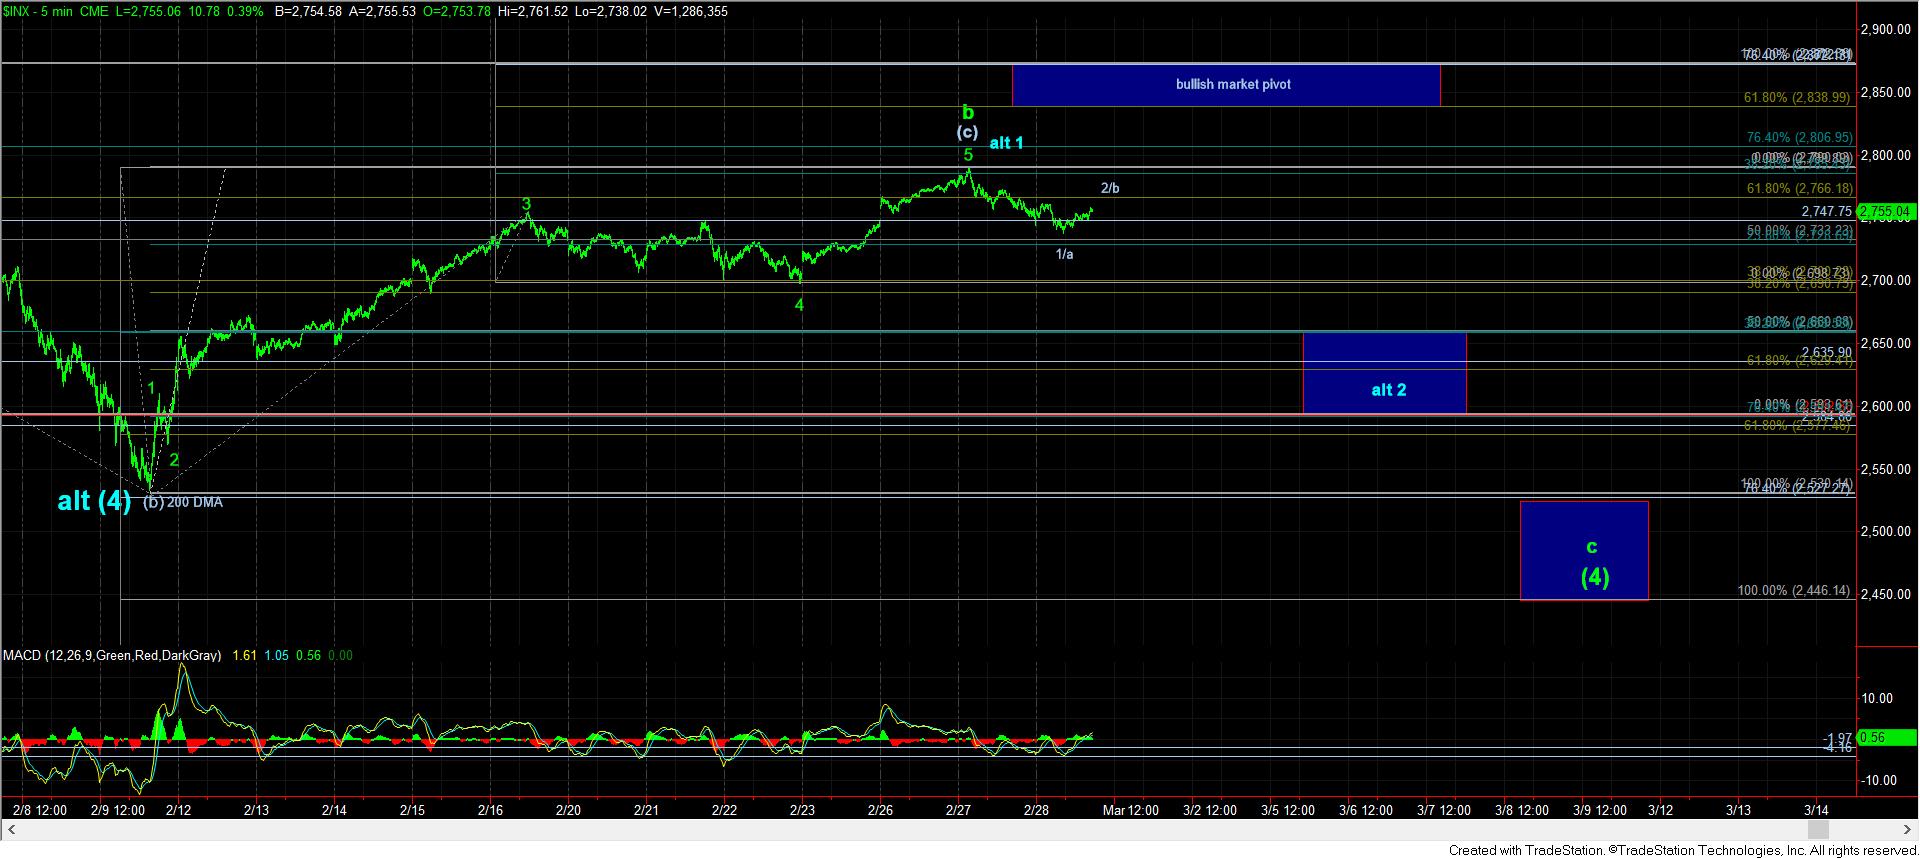
Our primary count has been that a b-wave of a larger degree wave (4) would be targeting the 2800 region, which would then set up a decline in a c-wave for wave (4).
But, in order to signal a high-probability drop in the c-wave, we need to see a clear 5 wave structure off the top of the b-wave high. Thus far, the best I can come up with on the downside is a leading diagonal. And, I do not view leading diagonals as strong trading cues. Rather, it leaves me questioning the potential of a c-wave drop from here.
As you can see from the attached chart, I have added a few things to the chart. First, I have counted this drop as either a 1/a off the highs, with the rally we are experiencing as I write this update as a 2/b. This should set us up for another drop, which will likely target the next lower blue box on the 5-minute chart.
But, as you can see, it certainly creates more questions than what I would have wanted to see thus far. Due to the fact that the drop off the highs was not a clear 5 wave structure, it certainly has put that blue count into greater perspective, which I will have to take a bit more seriously in the coming weeks.
I have also added in a market pivot overhead. You see, I am always looking for where I may be wrong in my count, and I always need signals to alert me to when I may be wrong. If the market would rally from here into that pivot, and follow through that pivot, it would open the potential that we are starting the rally to 3000 well before I had initially expected. For now, I see this as a low probability, but I have noted the resistance on the chart anyway.
Ultimately, I am looking for the market to set us up to drop in the coming days to at least the wave 2 box below. However, I cannot say there is a clear micro-set up to which I can point yet which would cause me to aggressively short for that box yet. I would prefer to see another impulsive 5-wave drop in another i-ii to the downside for either the c-wave of wave 2 off the high (blue count), or for wave 3 down in the bigger c-wave.
And, at this point in time, based upon the point at which we have classified as the b-wave high, our first target for the c-wave of (4) is at the prior lows at the 2530SPX region, wherein the c-wave is equal to .764 the size of the a-wave, with the potential to extend down towards the 2440SPX region wherein a=c. But, we will clearly need more information to determine if we are even in the bigger c-wave down, and which of the two targets is more likely.