Mixed Messages - But Potential Downside Set Up In Place
Sometimes it is nigh impossible to have a strong bias about the next imminent step the market is going to take. This applies almost exclusively within corrective market action. My expectation coming into this week was for a rally which would have us top out and begin a bigger decline phase. While we got a beautiful long set up when we came into the office on Monday, and caught over 50 points in that rally, since then, the market has become increasingly difficult.
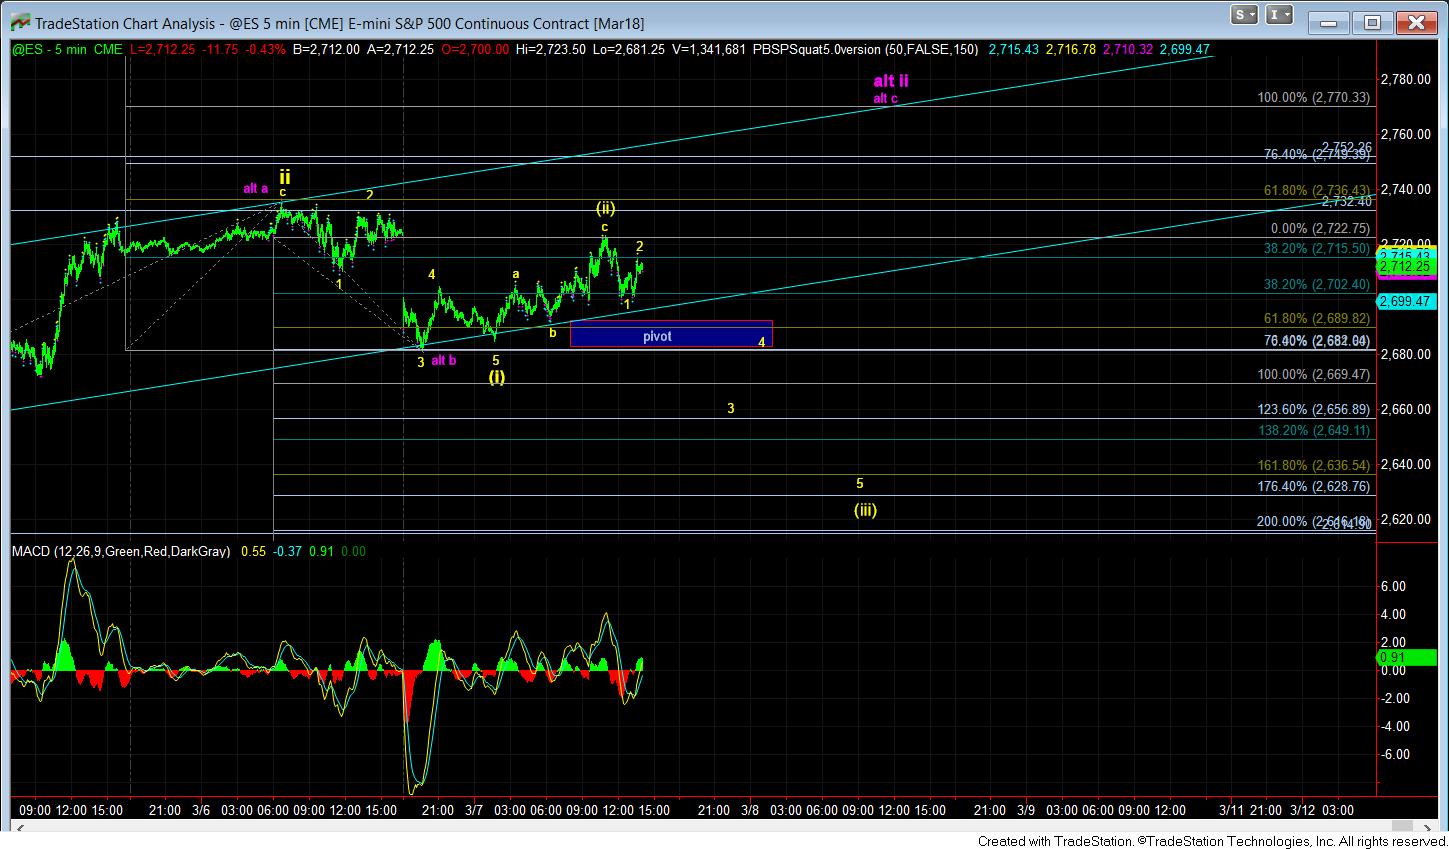
What complicates matters even more is when the SPX and the ES present in different ways. While the ES does have a more immediately bearish pattern being presented (which is not as clearly evident in the SPX), it, too, comes with its own issues. You see, the bottom that was struck overnight leaves us a question as to whether it was a corrective 3 wave decline, or if it completed 5 waves down off yesterday’s high. The issue is that the double bottom struck was not a lower low, and, at best, the structure can only be classified as an ending diagonal. I have placed a yellow (i) at the bottom of that potential 5 wave move down, but cannot rely on it confidently due to the truncated ending diagonal for a 5th wave of that (i).
I can probably bore you for the next half hour of reading with the convoluted potential patterns I am seeing and all the different possibilities, including the bullish ones, but I really don’t want to overwhelm you with too much technical speak. So, I am going to try to keep this update as simple as possible.
As long as we remain below yesterday’s high in the SPX/ES, pressure will remain down, with the potential to drop quite rapidly towards the 2600 region. In fact, if you look at the 5-minute ES chart, I have noted a pivot which we must break below in order to begin the downside pattern towards the 2600SPX region. However, should we break that pivot, and find support at 2669, the pivot then becomes resistance. Should we break back over the pivot from 2669ES, it suggests much more corrective upside action can be seen which can take us back over yesterday’s high. So, in order to see follow through down to the 2600SPX region this week, we would need to break below that pivot, and not come back up through it again should we test if from below.
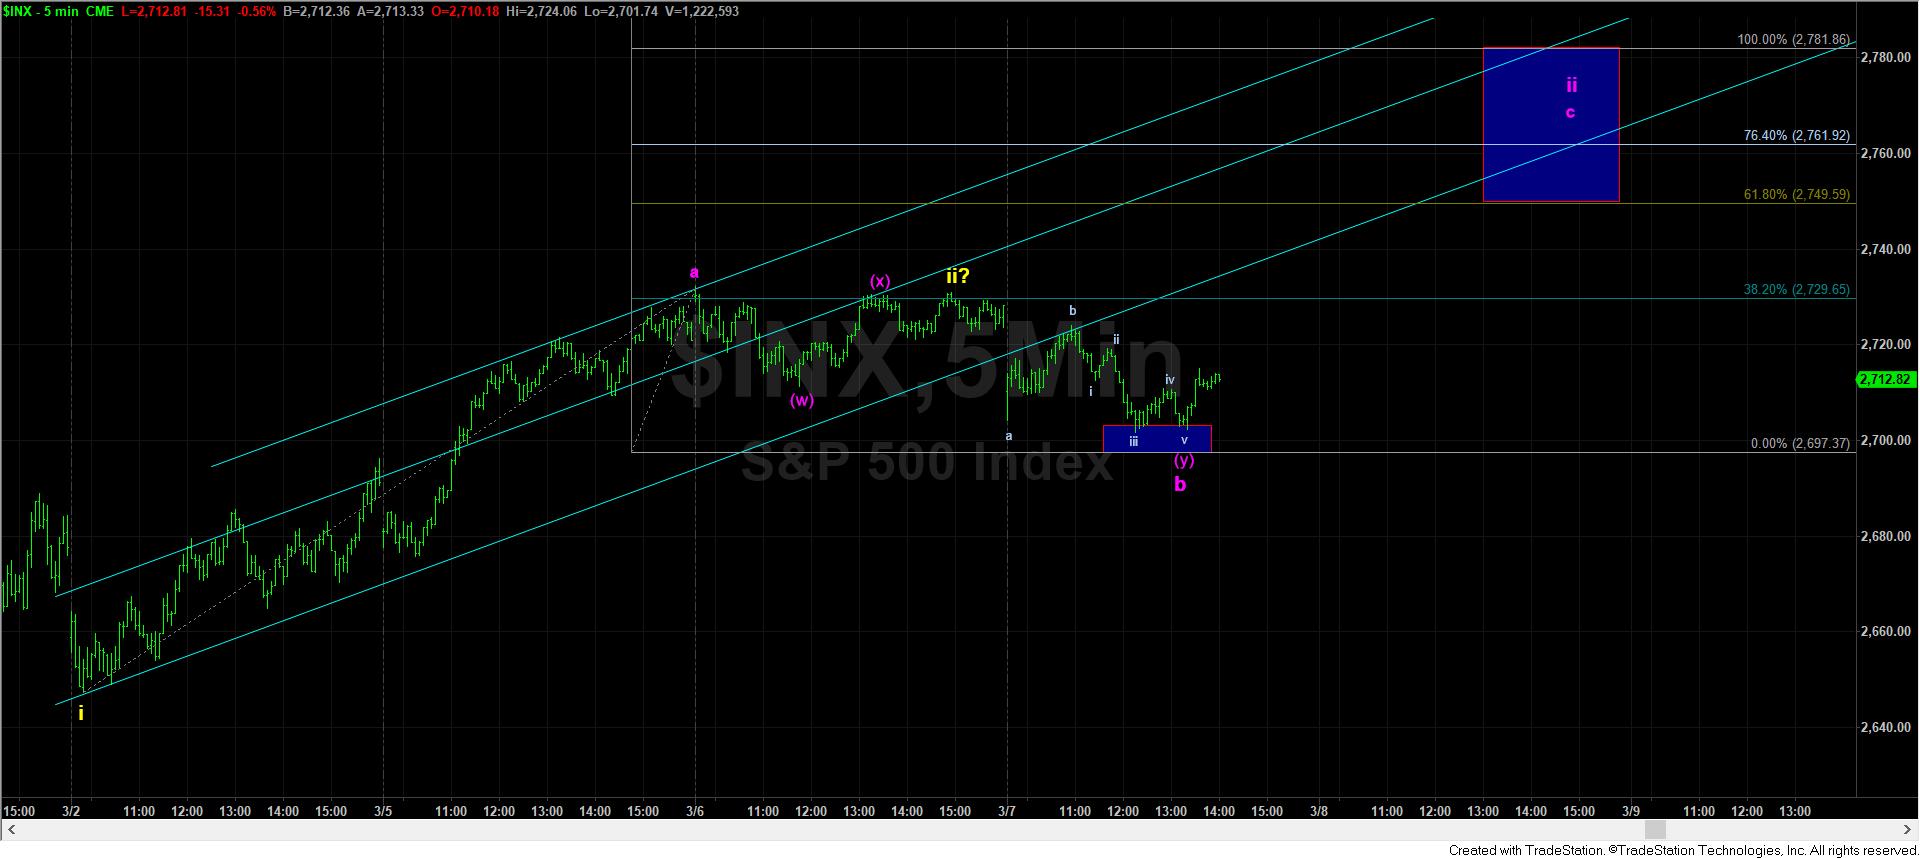
Alternatively, should we break out over yesterday’s high, it would suggest that this wave ii in SPX is likely heading up to at least the 2750SPX region (presented in purple).
I had to post the update early today since I have to leave a bit earlier today.