Micro Structure Is Unclear – But Suggests “Bottoming”
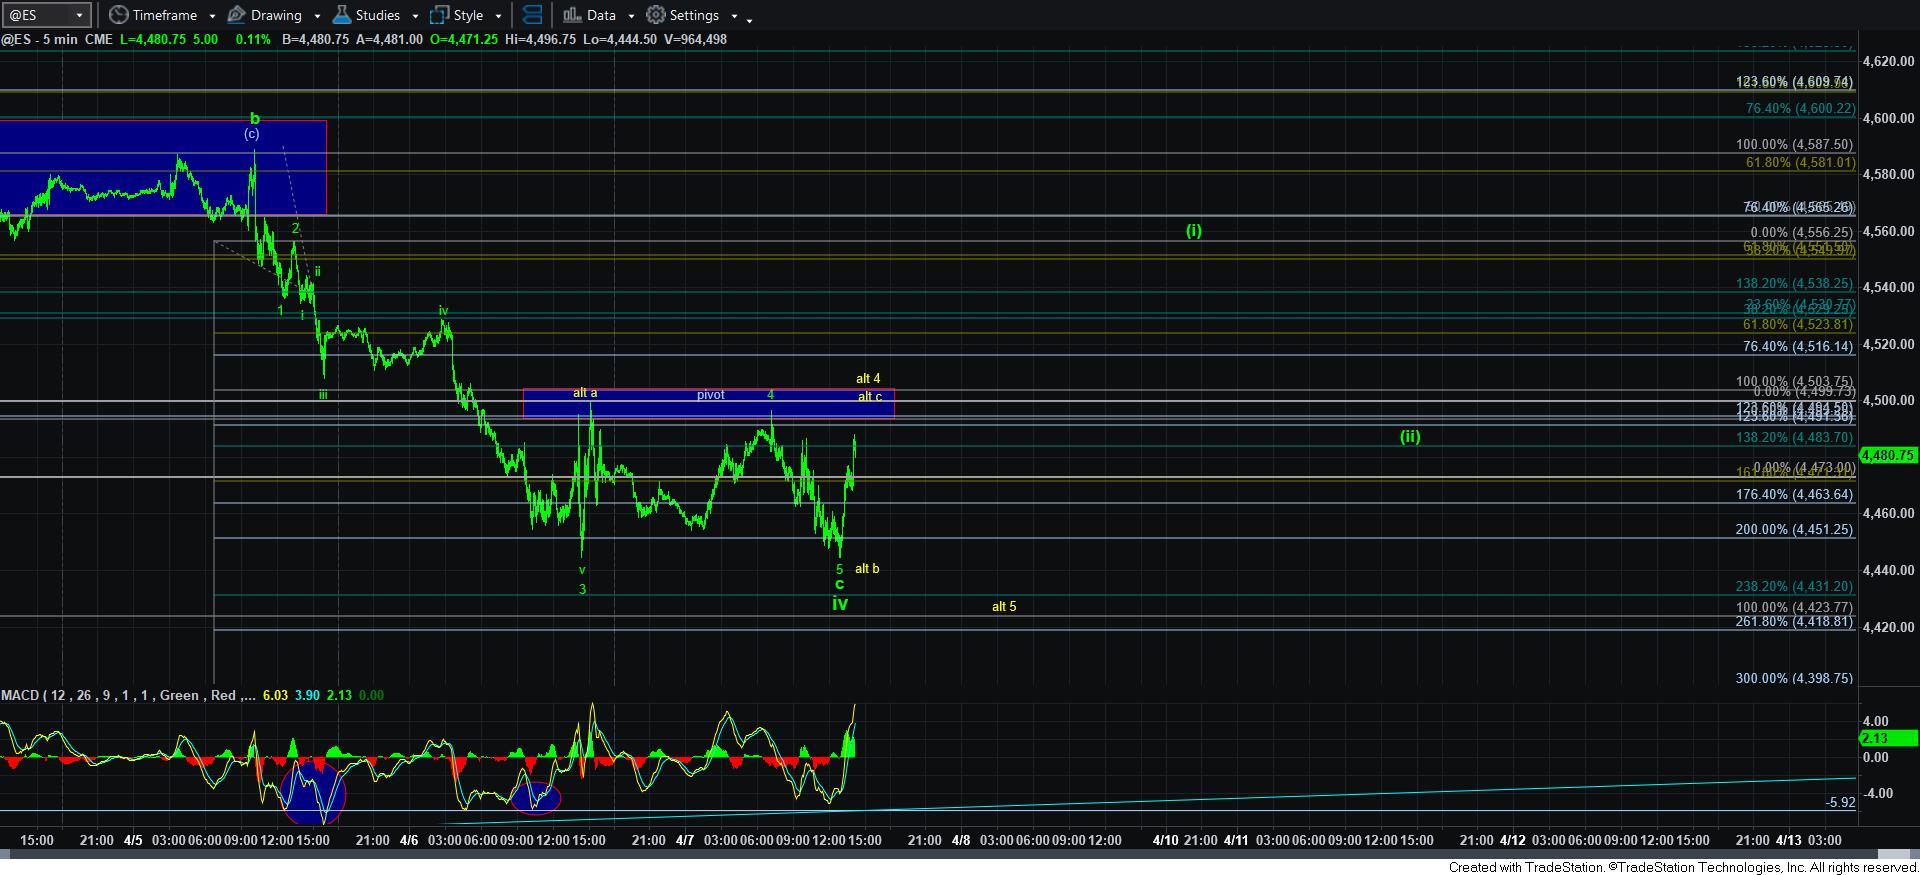
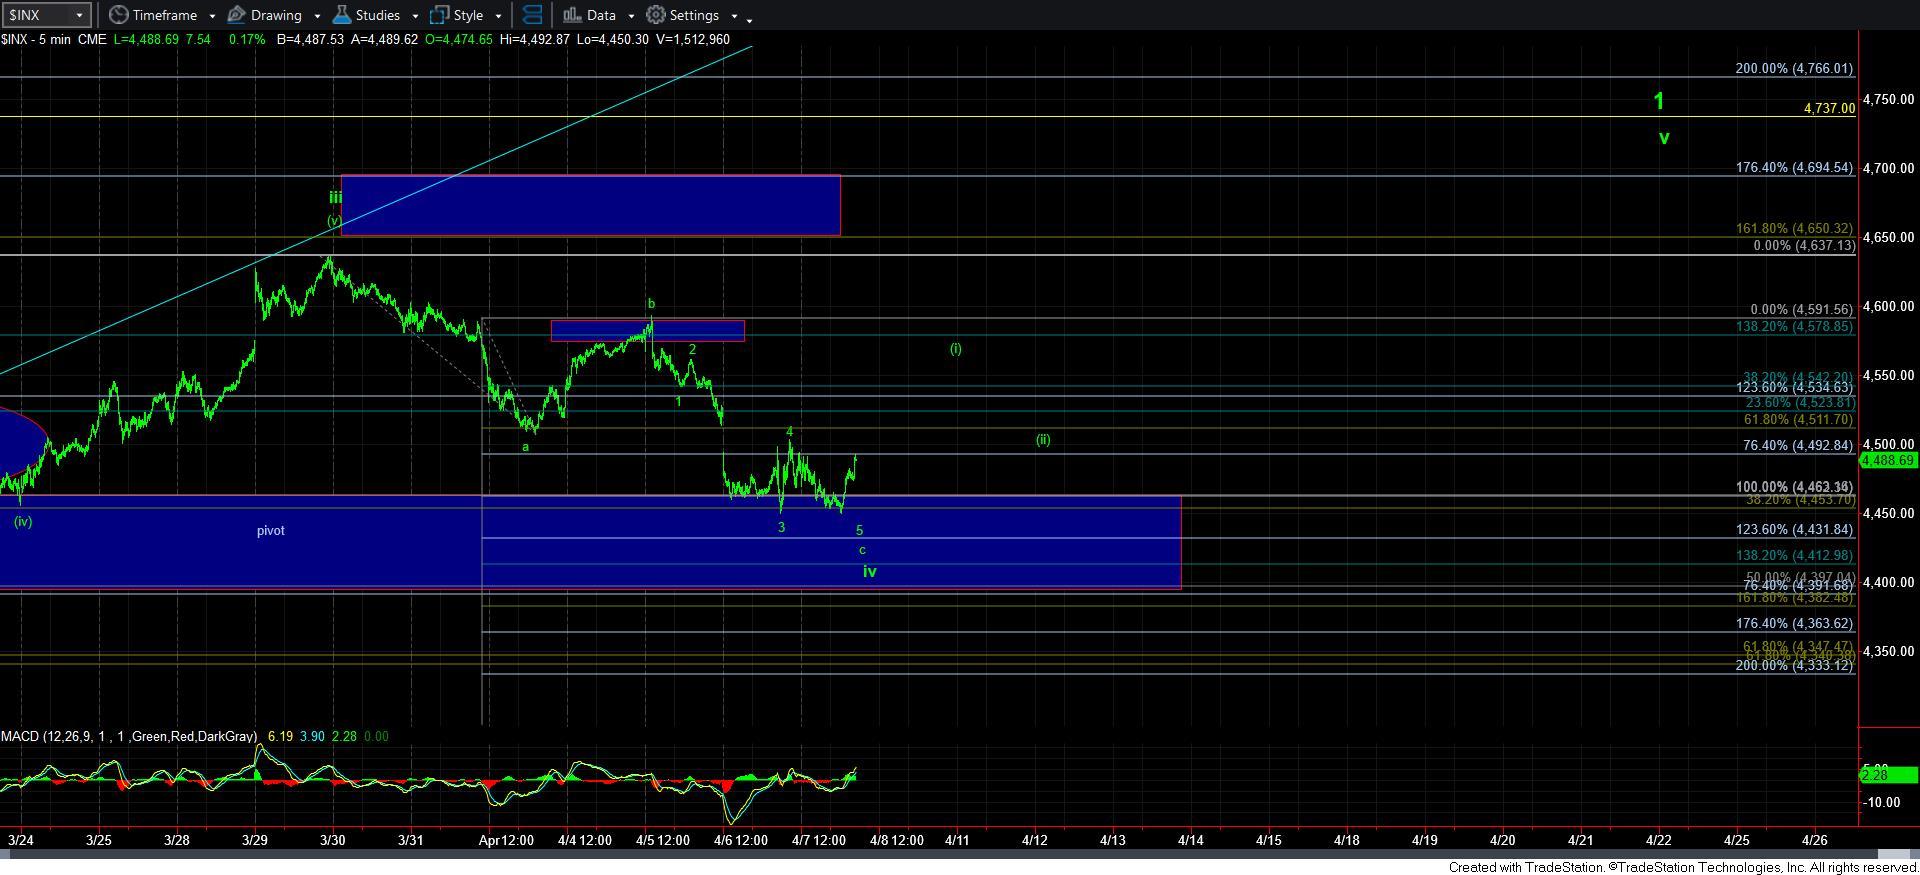
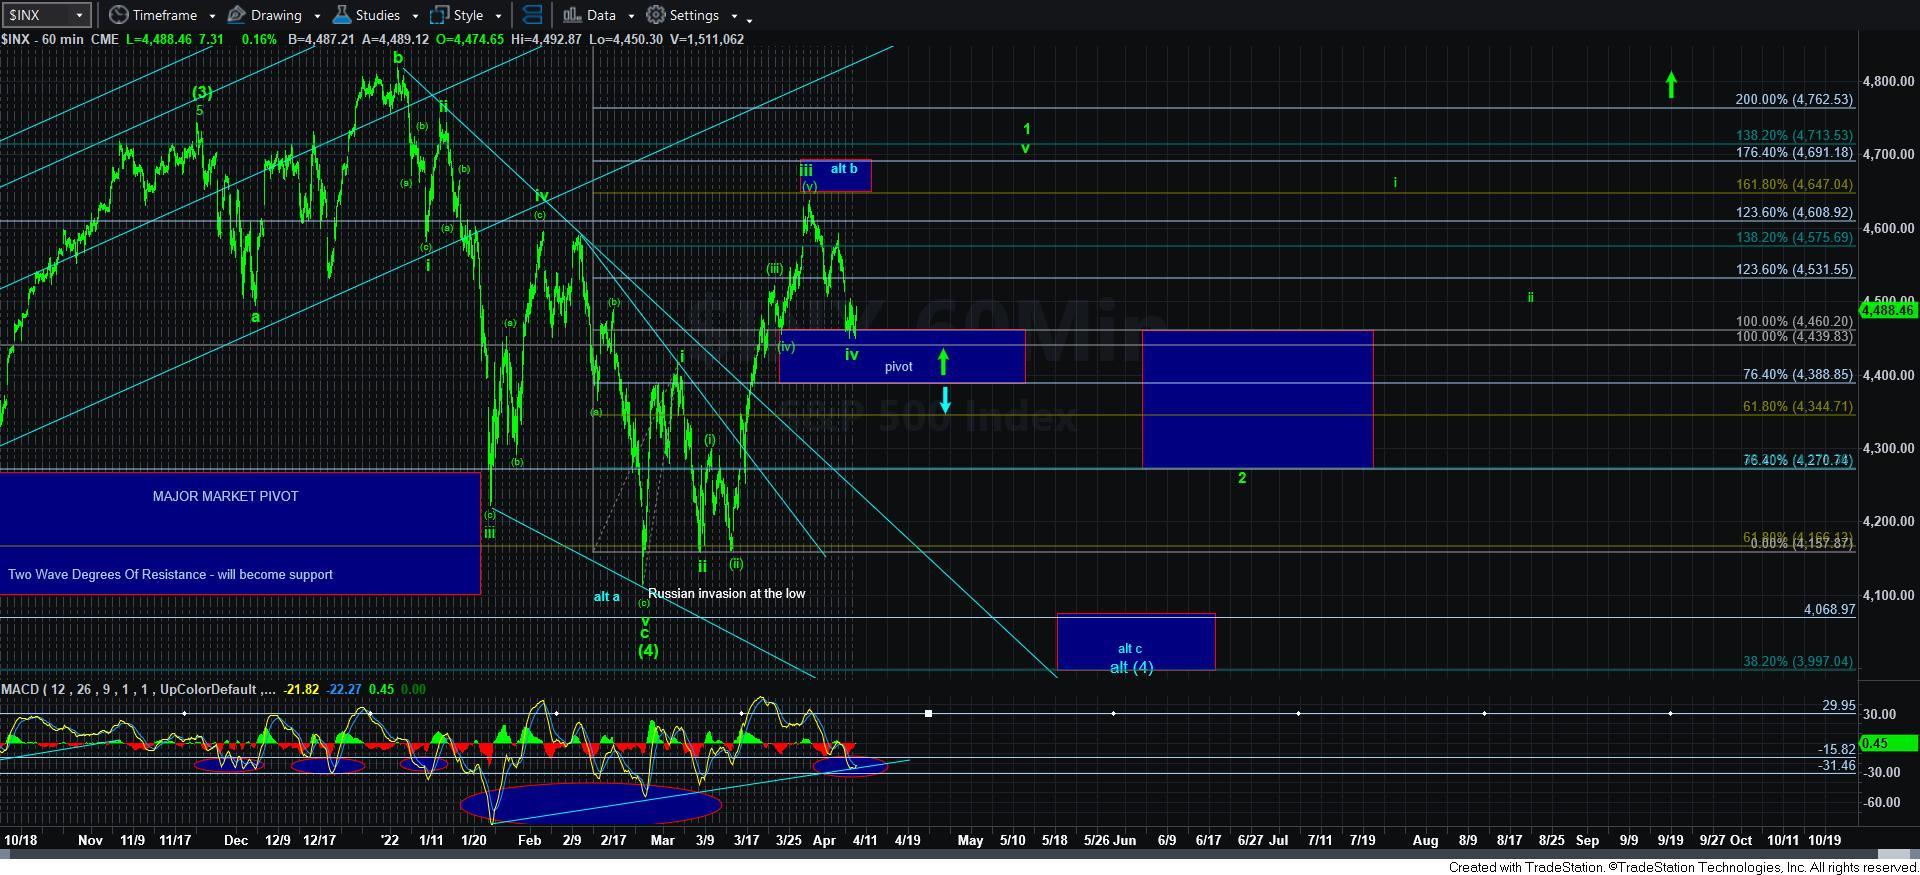
As I noted yesterday, we had the minimum number of waves in place to consider this a-b-c completed for wave iv right into our target region for wave iv, with positive divergences evident on the smaller degree timeframes, and with the 60-minute MACD coming into support.
As I write this now, the 60-minute MACD has now gone positive from its oversold condition, which is often a signal that a reversal is potentially in place, with some potential still being left over for a dreaded lower low, as outlined on the 5-minute ES chart in yellow.
Currently, the ES is still below its pivot/resistance noted on the 5-minute ES chart. And, when we move through it, it should signal that we are in wave [i] of wave v of 1. But, as I noted the other day, if you want to go long, most of our members would rather see a more definitive set up, which would be provided by a [i][ii] set up, with a rally thereafter through the high of wave [i]. For now, my primary expectation is that we will head to the 4700 region for wave v of 1, but the market offers no guarantees.
Overall, even if we do get that higher high, I still expect a big wave 2 retracement, and the higher that wave 1 takes us would mean that wave 2 would be deeper. Remember, the 1-2 should provide us with a 5-wave projection at the 2.00 extension which aligns with the 5500SPX region.
So for now, I am still looking for clearer evidence that the market has bottomed in wave iv.