Meandering Between Resistance And Support
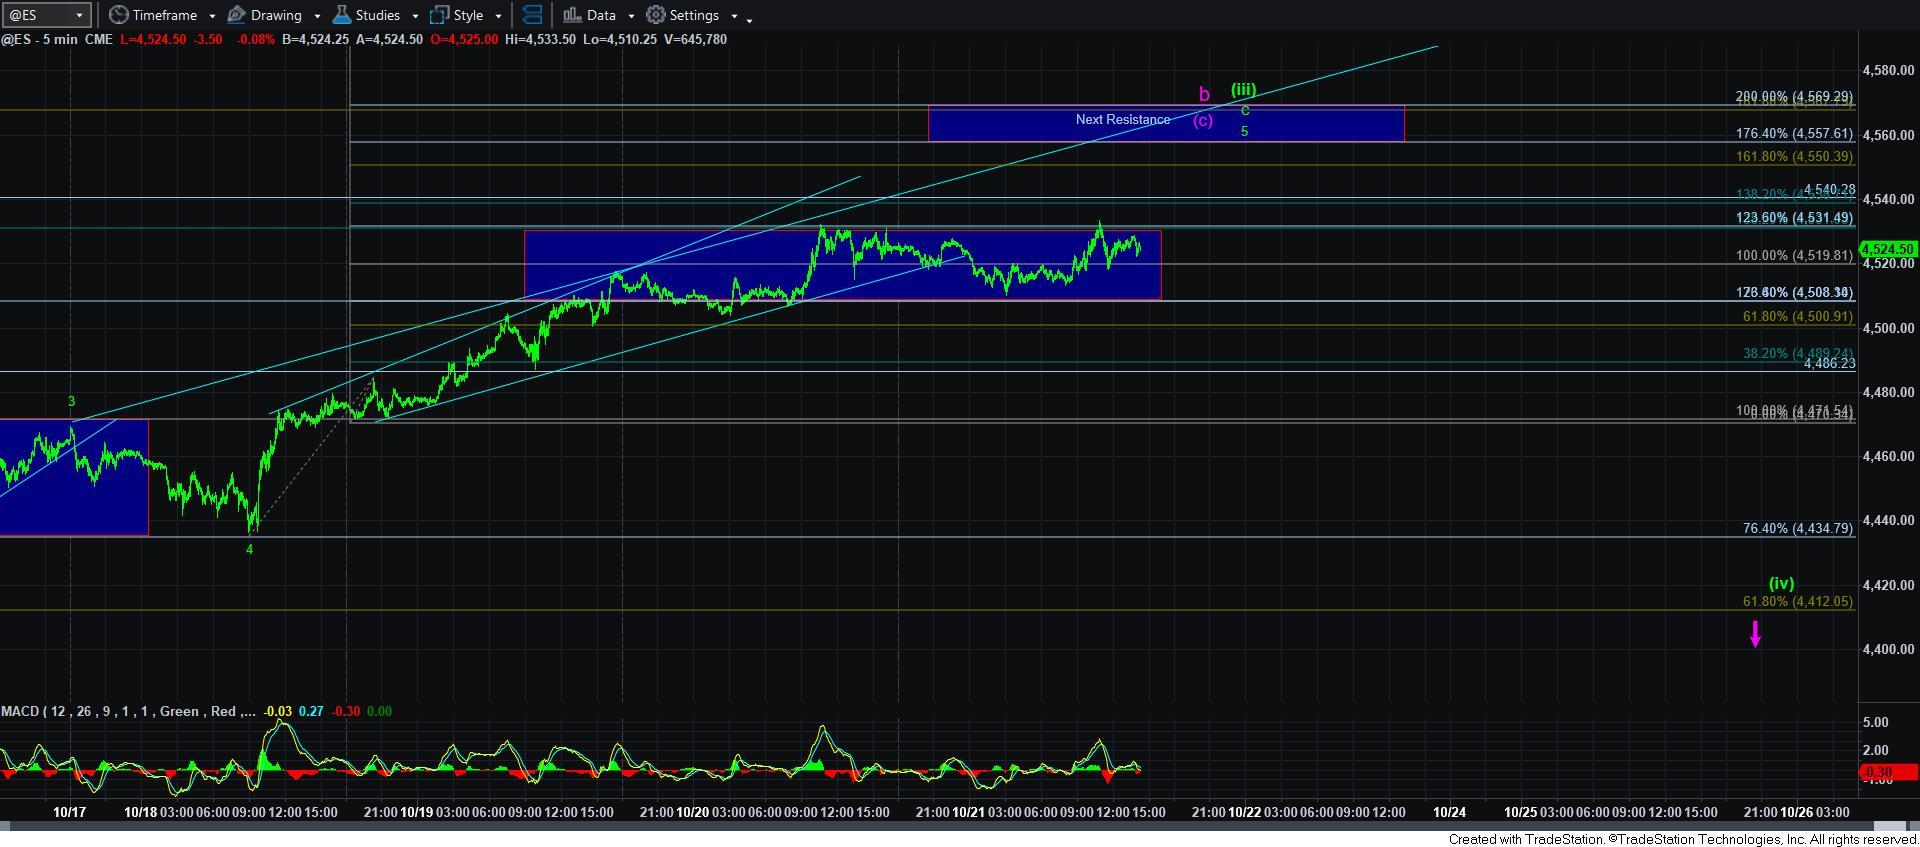
The market seems to be trying to make a decision as I write this update. While we clearly have enough waves in place, and we have struck the target for a standard wave [iii] within a diagonal, the market has not suggested it is going to turn down in a wave [iv] just yet. Rather, we have been bouncing between resistance and support these last few days.
To remind you, it is rare to see wave [iii] in a diagonal substantially exceed the 1.382 extension of waves [i] and [ii]. Yet, if we break back out over today’s high, that may be the markets intention, as it would then suggest we can push up towards the next resistance region on the 5-minute ES chart.
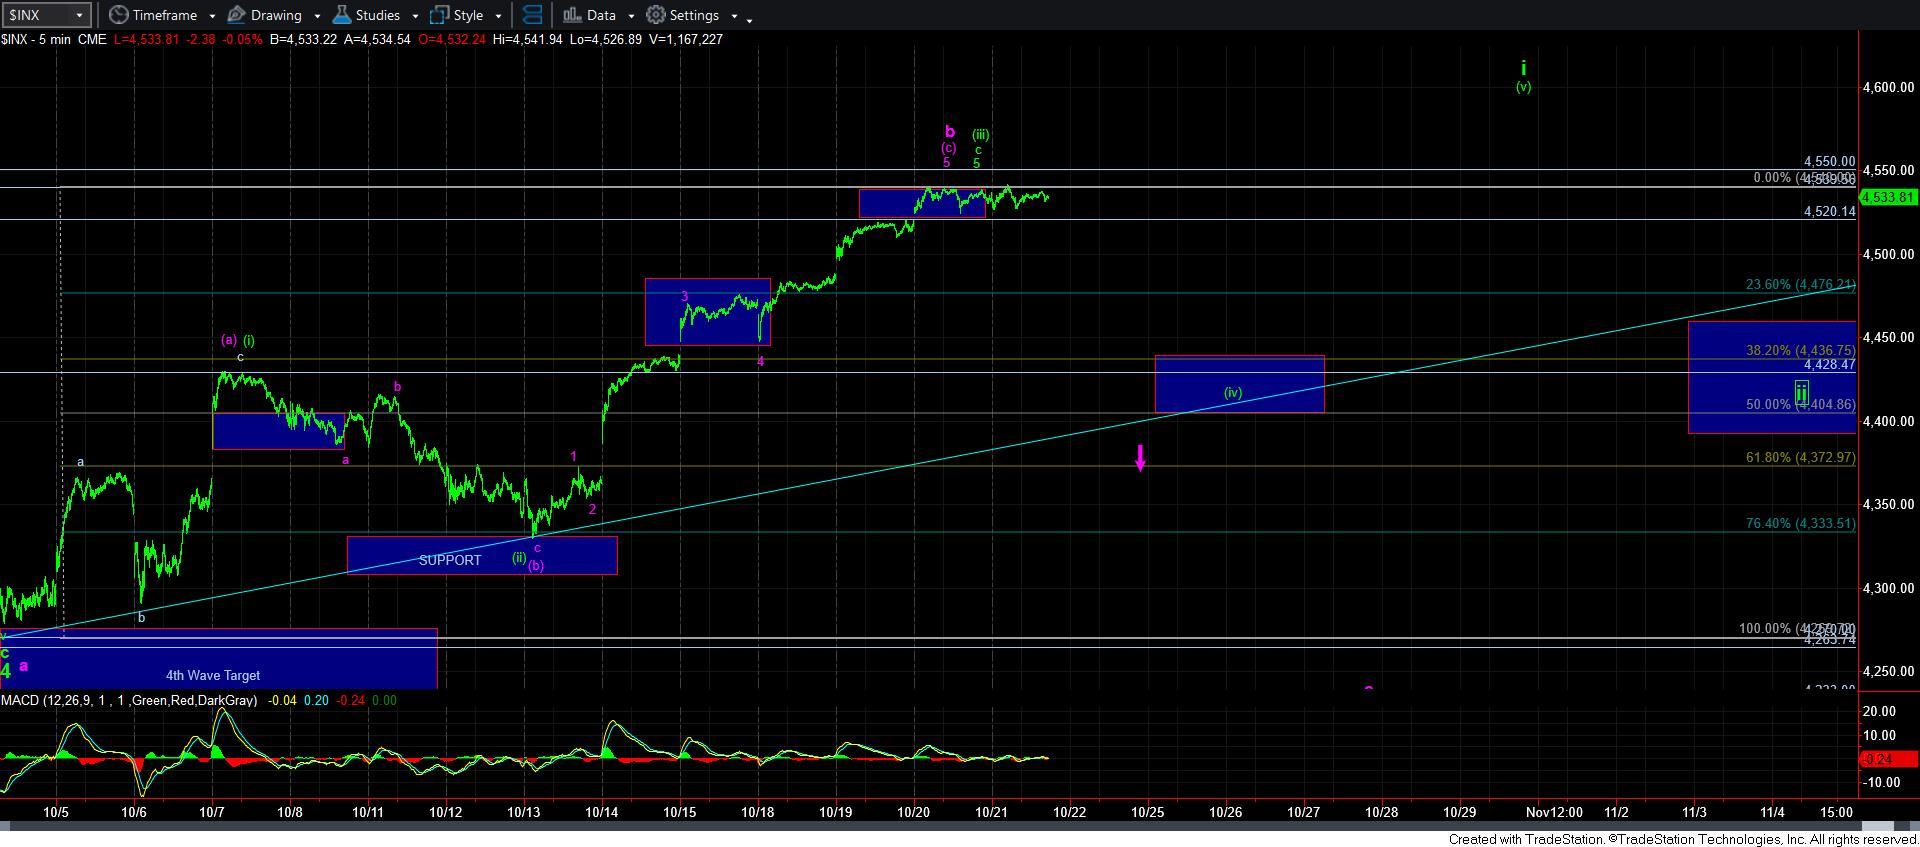
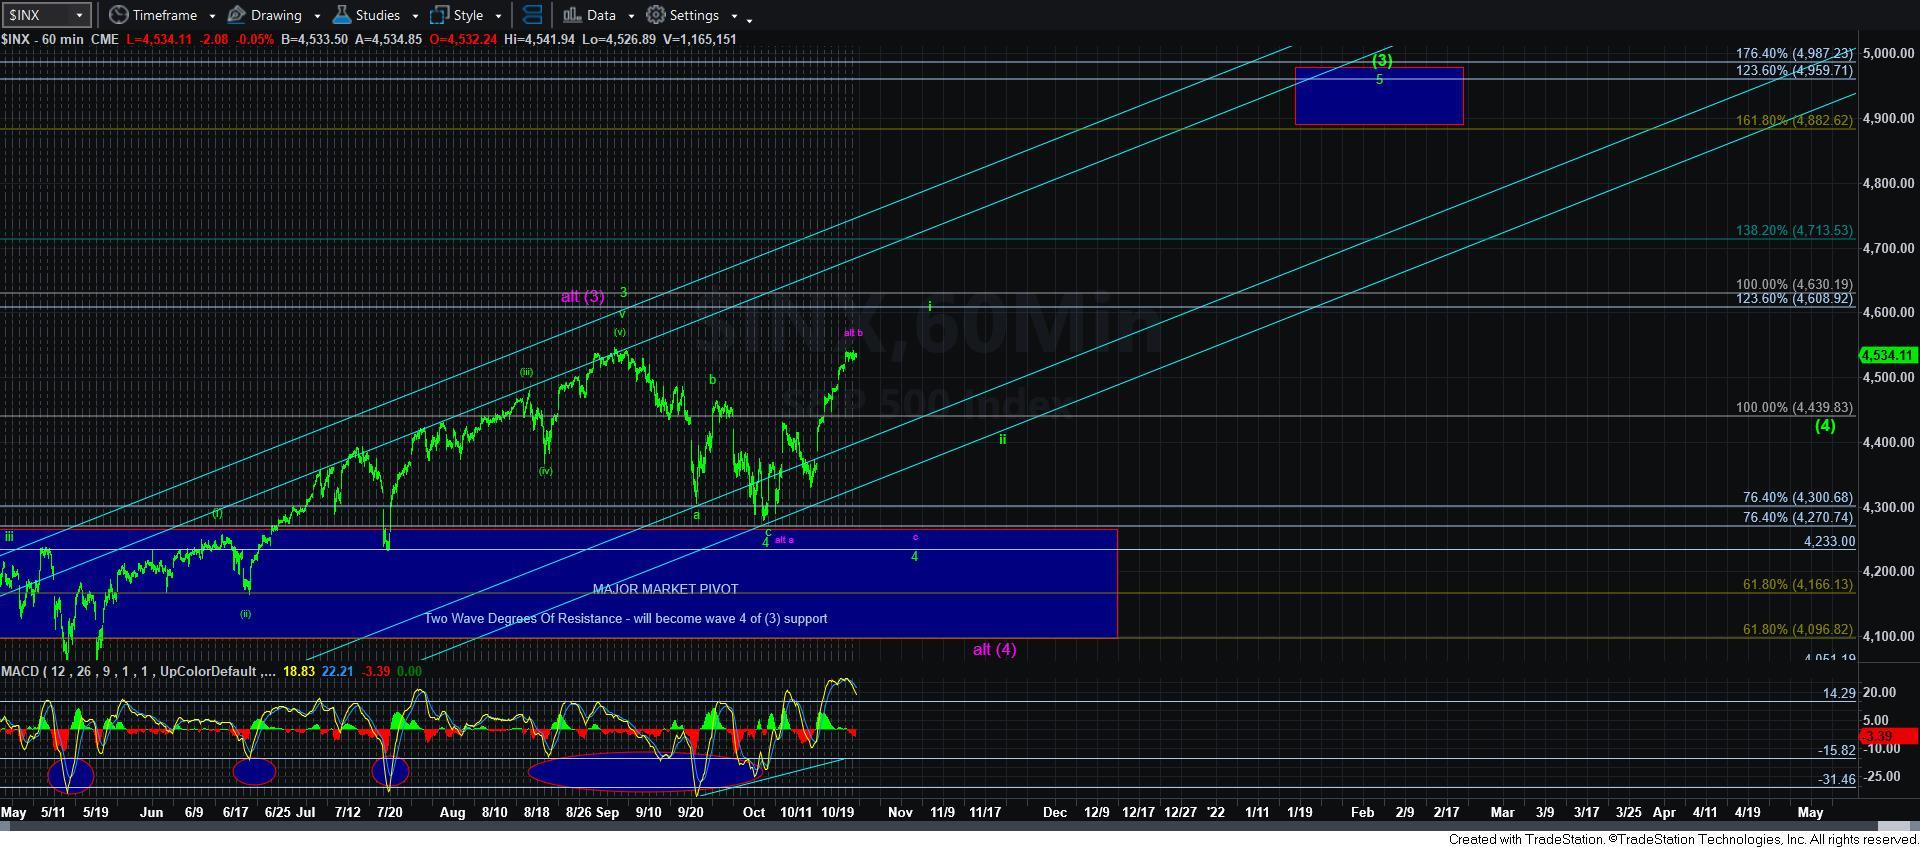
What such a move would do would weaken the green count, as I noted that it is not often we see such an extended 3rd wave within a diagonal. Therefore, I would have to go back to being 50/50 between the two counts we are tracking. And, again, the nature of the next decline would be the key as to whether our next buying opportunity will be in the 4230-4270SPX region or if the 4400SPX region will be that buying opportunity during the wave [iv] corrective pullback as well as the wave ii pullback in green.
I also want to copy something I posted earlier today in an alert to members in the trading room, as I believe it is important to maintain the appropriate focus:
“While many seem to be viewing the market through the lens of bearishness or bullishness, I would like to move your thinking from this black and white perspective to the grey zone.
The market has now been trading in the same region for the last 3 months. The question we are trying to answer at this time is where the next buying opportunity will come from before we head to 4900SPX next. And, until we see how the next pullback takes shape, the options are 4230-4270, or 4400SPX region. That is how you should be viewing the market at this time - WHERE IS MY NEXT BUYING OPPORUTUNITY FOR THE NEXT RALLY INTO 2022.”
So, for now, as long as the market holds the 4508ES support, it still has a path higher to the next resistance region outlined on the ES chart. However, if we can break back below 4508ES sooner, then the nature of the decline will provide for us indications as to whether the pullback is a corrective wave [iv] in the green count or the start of the purple c-wave. For now, I lean towards the green, but will make final decisions based upon the nature of the next decline below 4508ES.


