May See A Bit More Risk-Off In The Coming Weeks
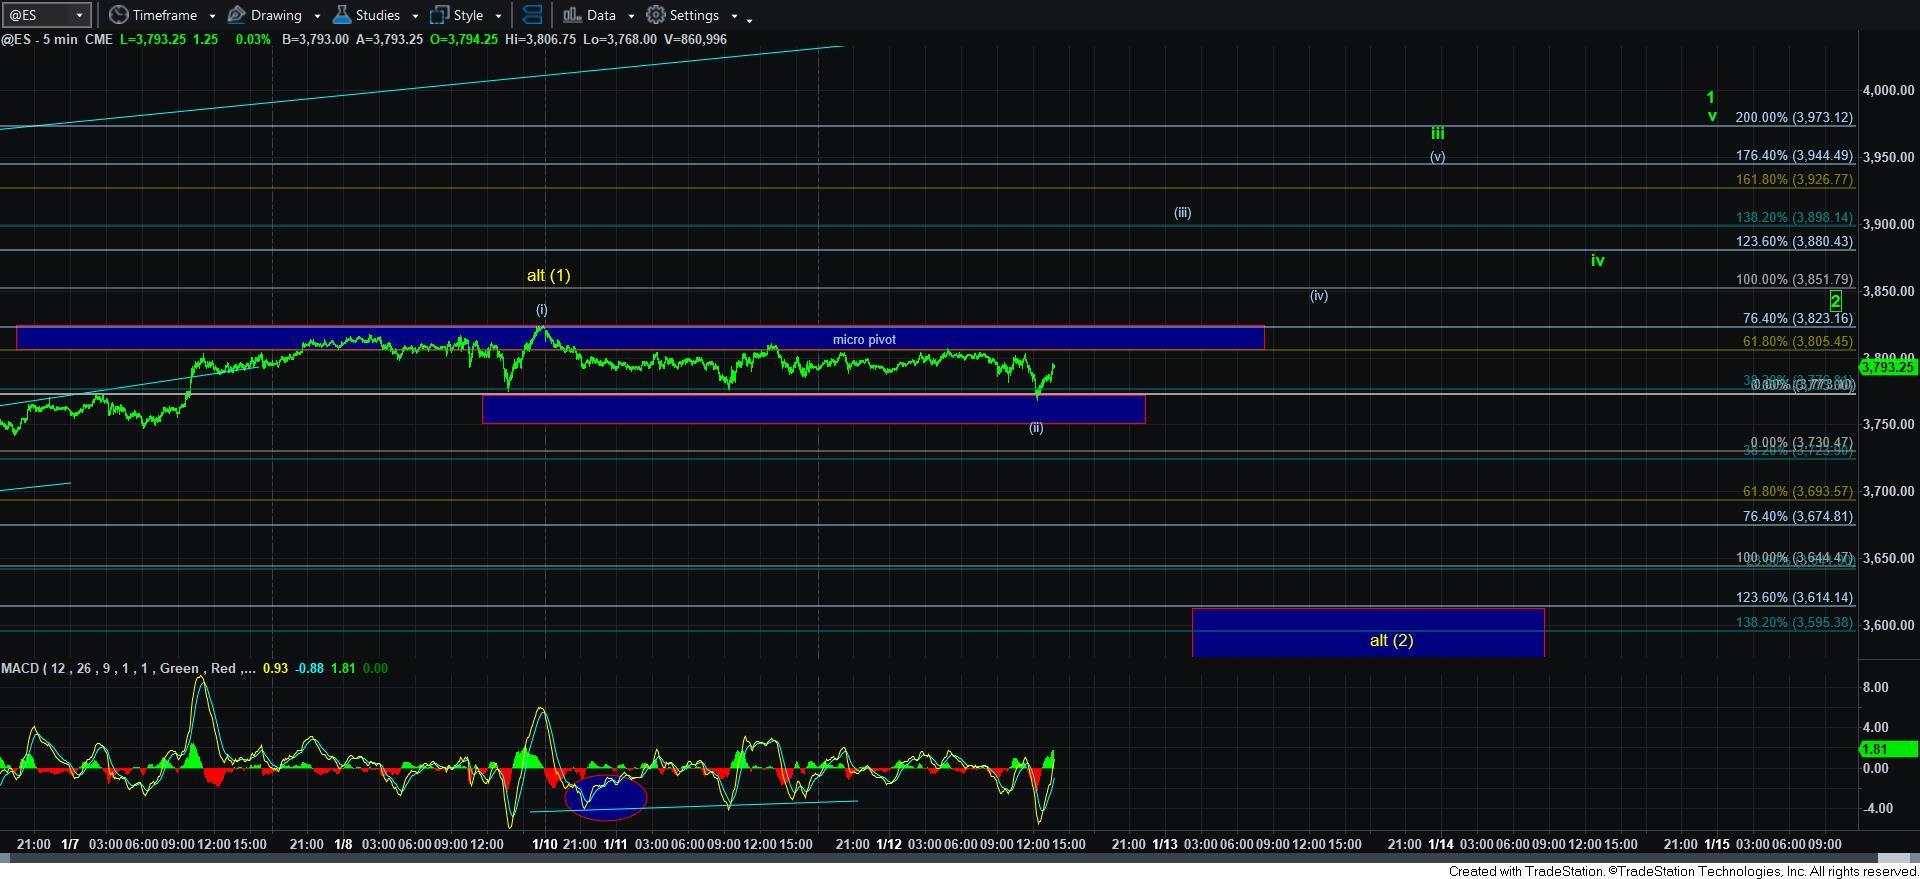
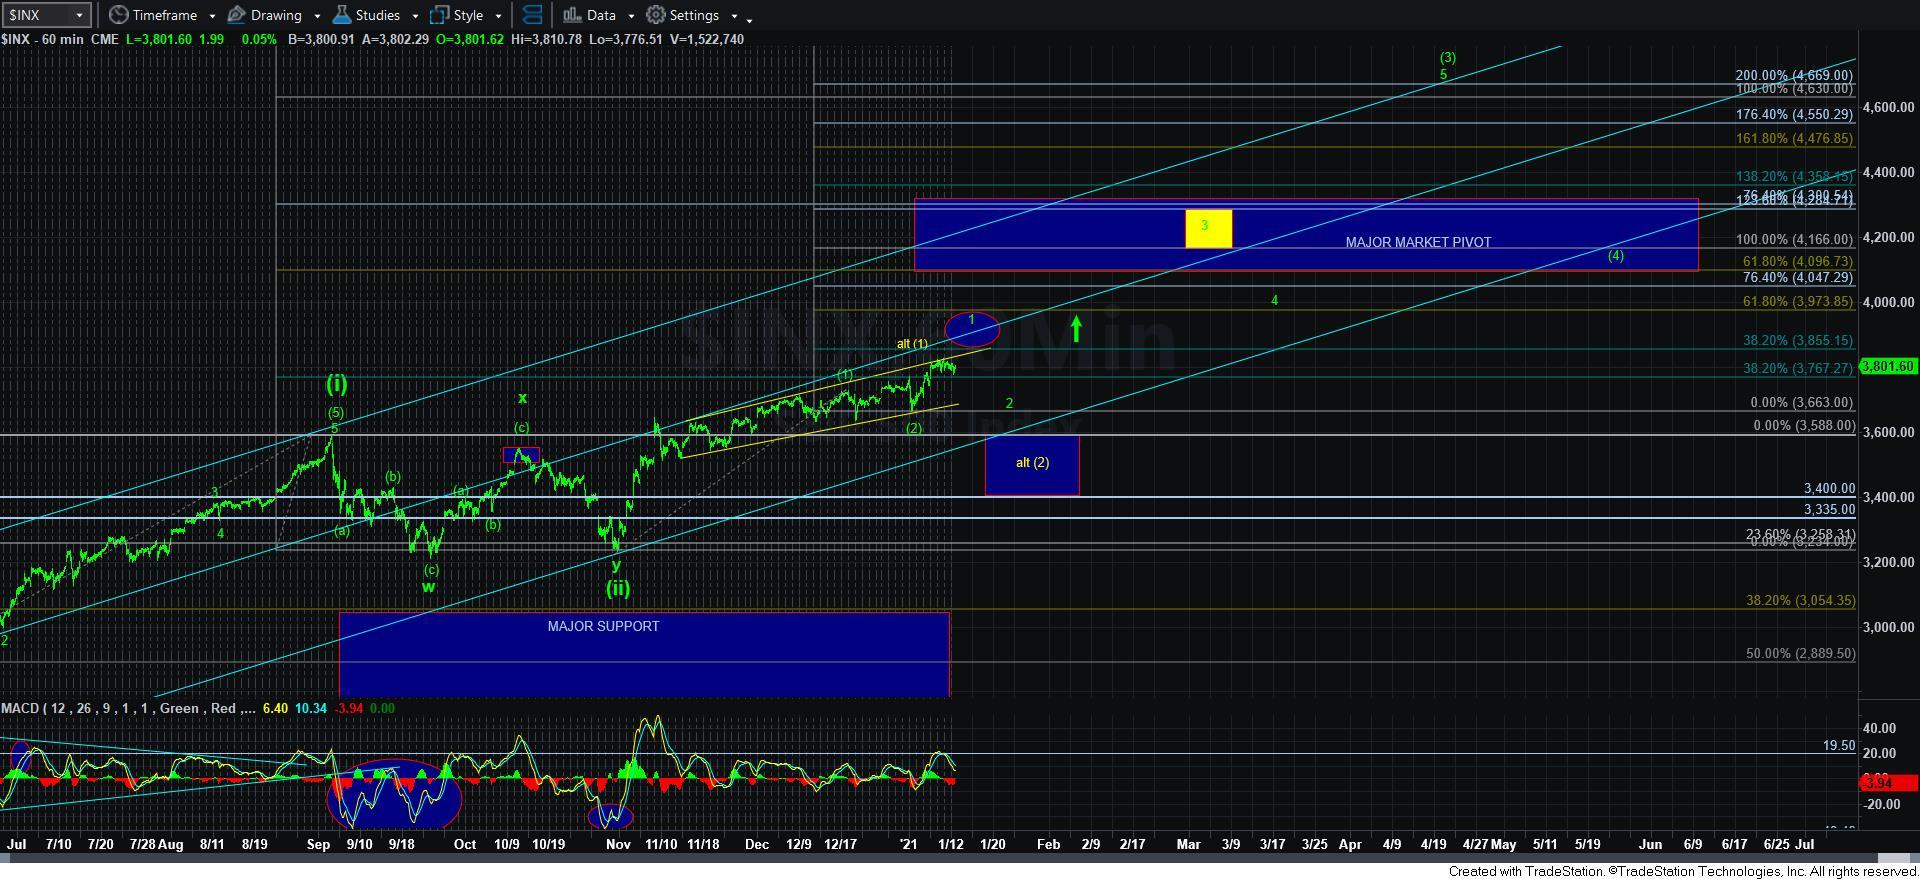
Since the start of November, the SPX has now been in an up-trending, overlapping structure that has maintained within the confines of the yellow trend channel you can see on our 60-minute SPX chart. But, that overlapping structure has wreaked havoc with my ability to define a solid micro structure within that overlap. And, it is for this reason that the alt [2] count has not completely lost is yellow luster.
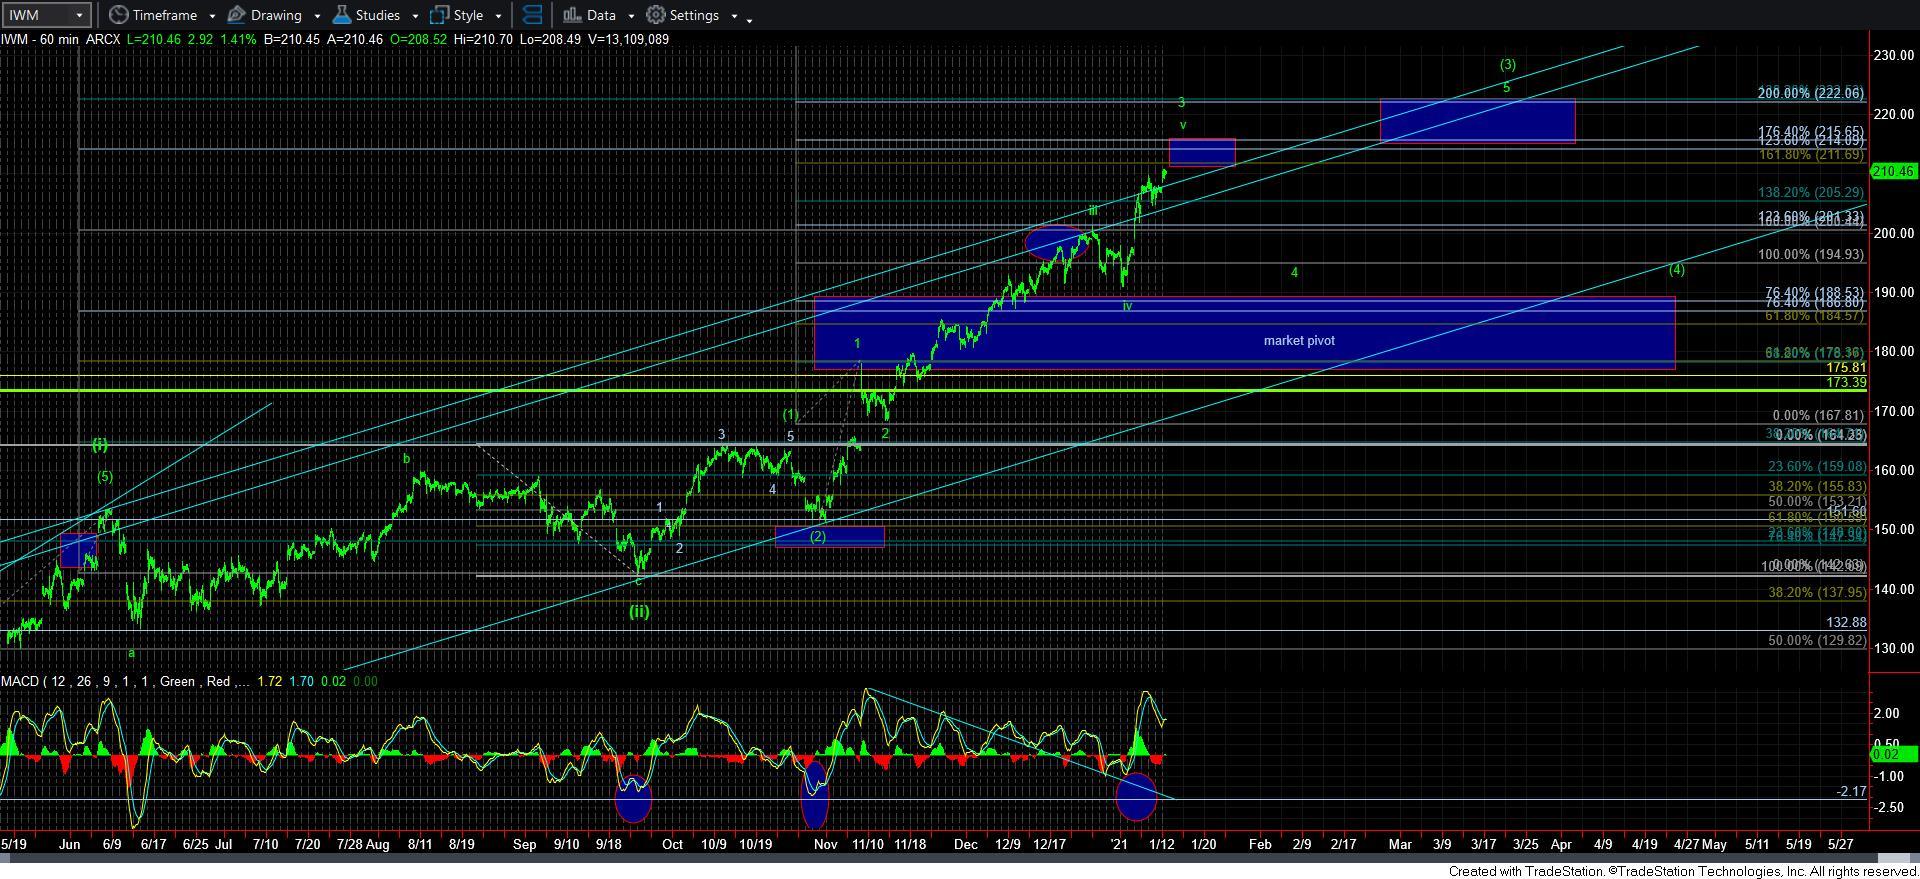
However, at the same time, the IWM has been trading through its wave progression within wave [3] in an almost textbook manner. In fact, today, we are just about to strike the bottom of the target box between 211-215 I placed on the chart as our wave 3 target months ago.
So, while I have been struggling to determine if waves [1] and [2] have completed in the SPX, the IWM is telling me something to which I think I should be paying attention.
Now that we are coming to our wave 3 of [3] target, I think I am going to be viewing the IWM as setting up for a risk-off period wherein we can see a pullback to the 195 region, which is the 1.00 extension of waves [1] and [2]. So, for this reason, I think it is somewhat prudent to expect some form of market weakness in the coming weeks.
But, PLEASE do not assume that I am now bearish the market or that it is time to aggressively short the market, as this is simply a standard 4th wave pullback within wave [3] of [iii]. The larger trend is still quite bullish as we look out towards the rest of 2021. Yet, as noted, it is reasonable to expect a period of risk off as we are nearing the completion of the wave 3 of [3].
Yet, it still leaves us wanting for more detailed answers about the smaller degree wave structure in the SPX. Have [1][2] already completed, or are we going to get a commensurate pullback in the SPX relative to the IWM wherein the weakness will provide us with a more visible wave [2], as presented in yellow?
There is a strong argument to view the potential risk-off period in the IWM as having greater probability to be more perceptible than the SPX, as the SPX still has to catch up to the IWM in its wave count. Consider that the same wave degree in the SPX as that being completed in the IWM in the near term is actually presented on the 60-minute SPX chart in the little yellow box. That means it is still reasonable to expect a period of time wherein the SPX outperforms the IWM in order to catch up.
So, does this mean the SPX will only pullback in a 1-2 structure within its wave [2], or it will provide us with a commensurate pullback potentially as a wave [2] in yellow? These are questions I am unable to answer at this time, but I thought I needed to at least highlight the issues to you so that you can make more informed decisions within your own portfolio management determinations.
But, wherever we top out in this region within the SPX and then see a pullback, whether it be 2 of [2], I think we can all easily understand that a break back out over whatever high we strike in this region is going to provide us with a strong indication that the heart of the 3rd wave is upon us, and we will likely be in a catch-up phase to the IWM at that time.
So, for now, I am still going to remain a bit more patient until the SPX clarifies where waves 1 and 2 of wave [3] appropriately form, so we can become much more aggressive on the long side when we begin the wave 3 of [3] phase pointing us to the 4165-4300SPX region in the coming months.
In the smaller degree structure, while we did break down below yesterday’s low, we have yet to follow through below 3750ES to open the door to a higher probability for the yellow wave [2]. The bulls still hold the ball. Should they be able to take out the pivot, I think it is still more reasonable to view it then as wave 1 of [3], and if it can push us up as high as the 3975SPX region in the coming week or so, that would solidify that wave count for me, at which time I would expect a strong reaction to the downside for a wave 2 pullback.
In the meantime, I don’t think we yet have the smaller degree set up pointing us to the 4165-4300SPX region sooner rather than later. So, I am personally in no rush to be trading aggressively to the long side just yet. I am still waiting for that ideal 1-2 break out set up before I turn laser focused on the yellow box target on the 60-minute chart.