Markets Take A Break From The Melt-Up
 By
By
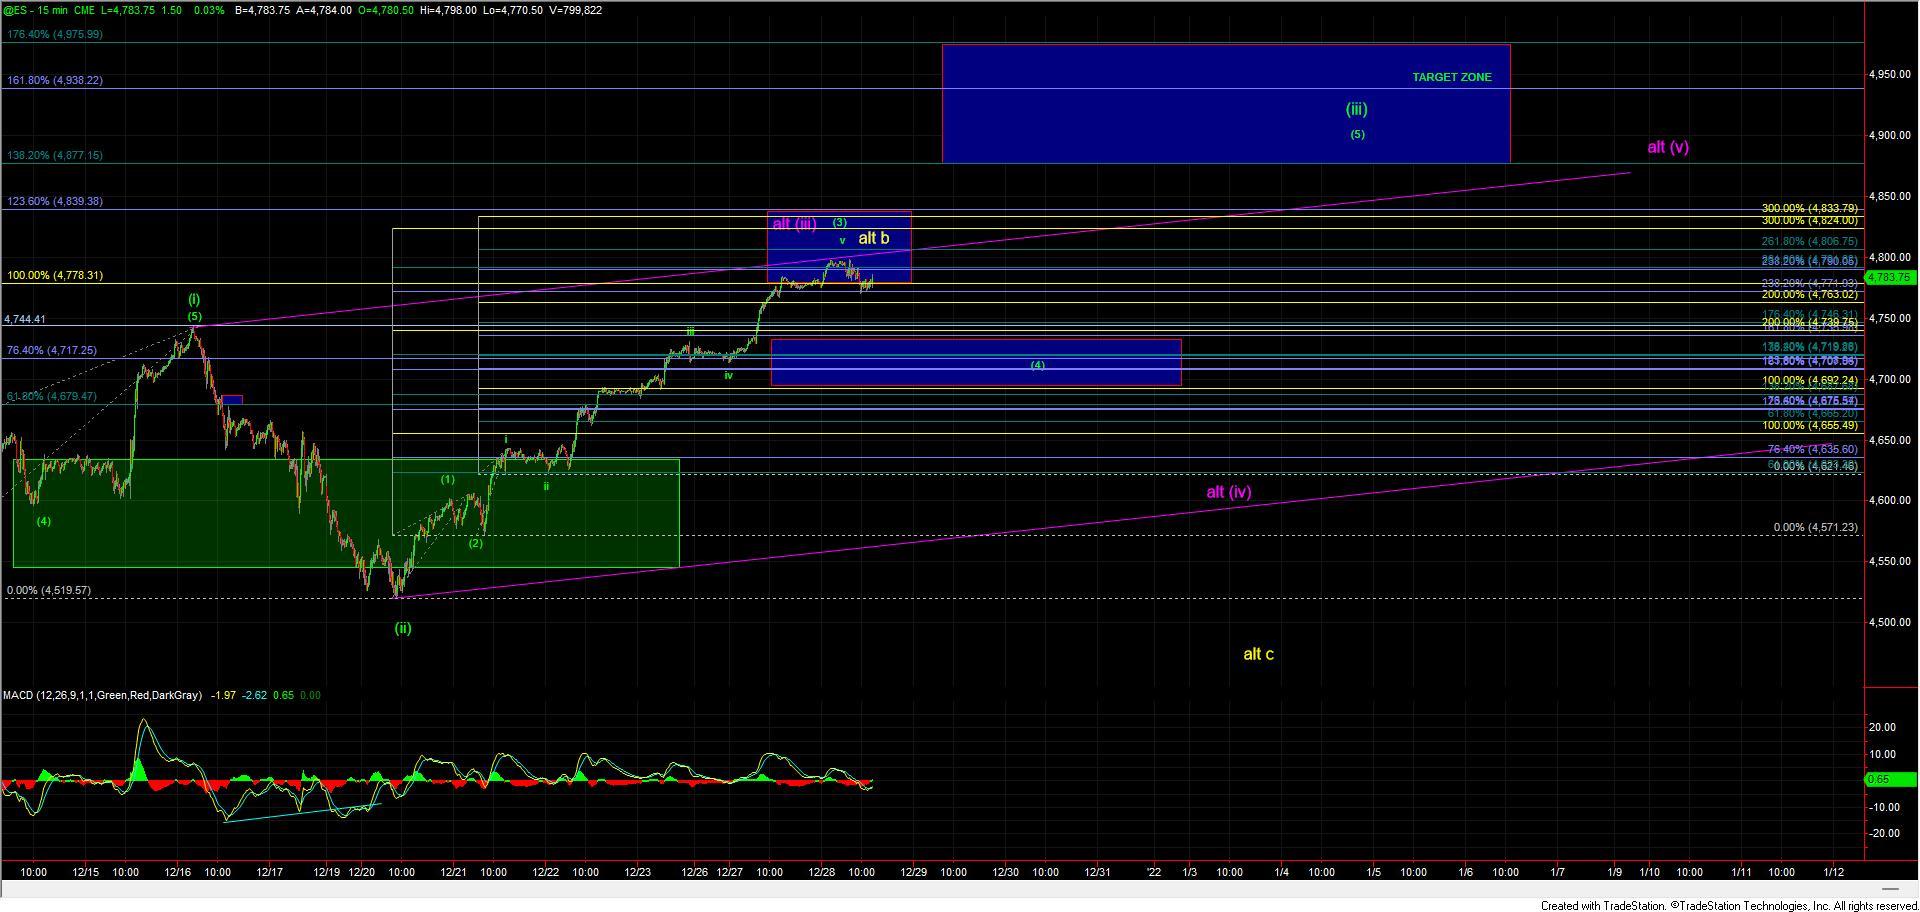
Today we saw the ES push beyond the key 100ext at the 4778 level and topped right in the middle of the ideal target zone for the wave (3) which came in at the 4778-4839 zone. Although we did break the 4778 level we did fail to make it all the way up to the next key overhead fib at the 4839 level overhead and have spent most of the afternoon retracing lower and have since moved back under the 4778 level. The move down off of the high is so far looking corrective in nature which is suggestive that this is still a corrective move within a larger degree push higher rather than the start of the larger yellow wave c down. We are also closing in on the 4763 level and I would view a break of this level as the initial signal from pure price perceive that we have put in at least a local top in the green wave (3). I will note however that I can make the case that the RTY has a full five down off of the highs, thus I do think it is becoming more likely that the SPX may have also already put in a local top as well. Support for the green wave (4) now comes in at the 4735-4692 zone and as long as we can hold this zone they the bae case will remain that any pullback lower is simply a corrective retrace for that wave (4) still needing another wave (5) of (iii) up towards that 4877-4975 zone.
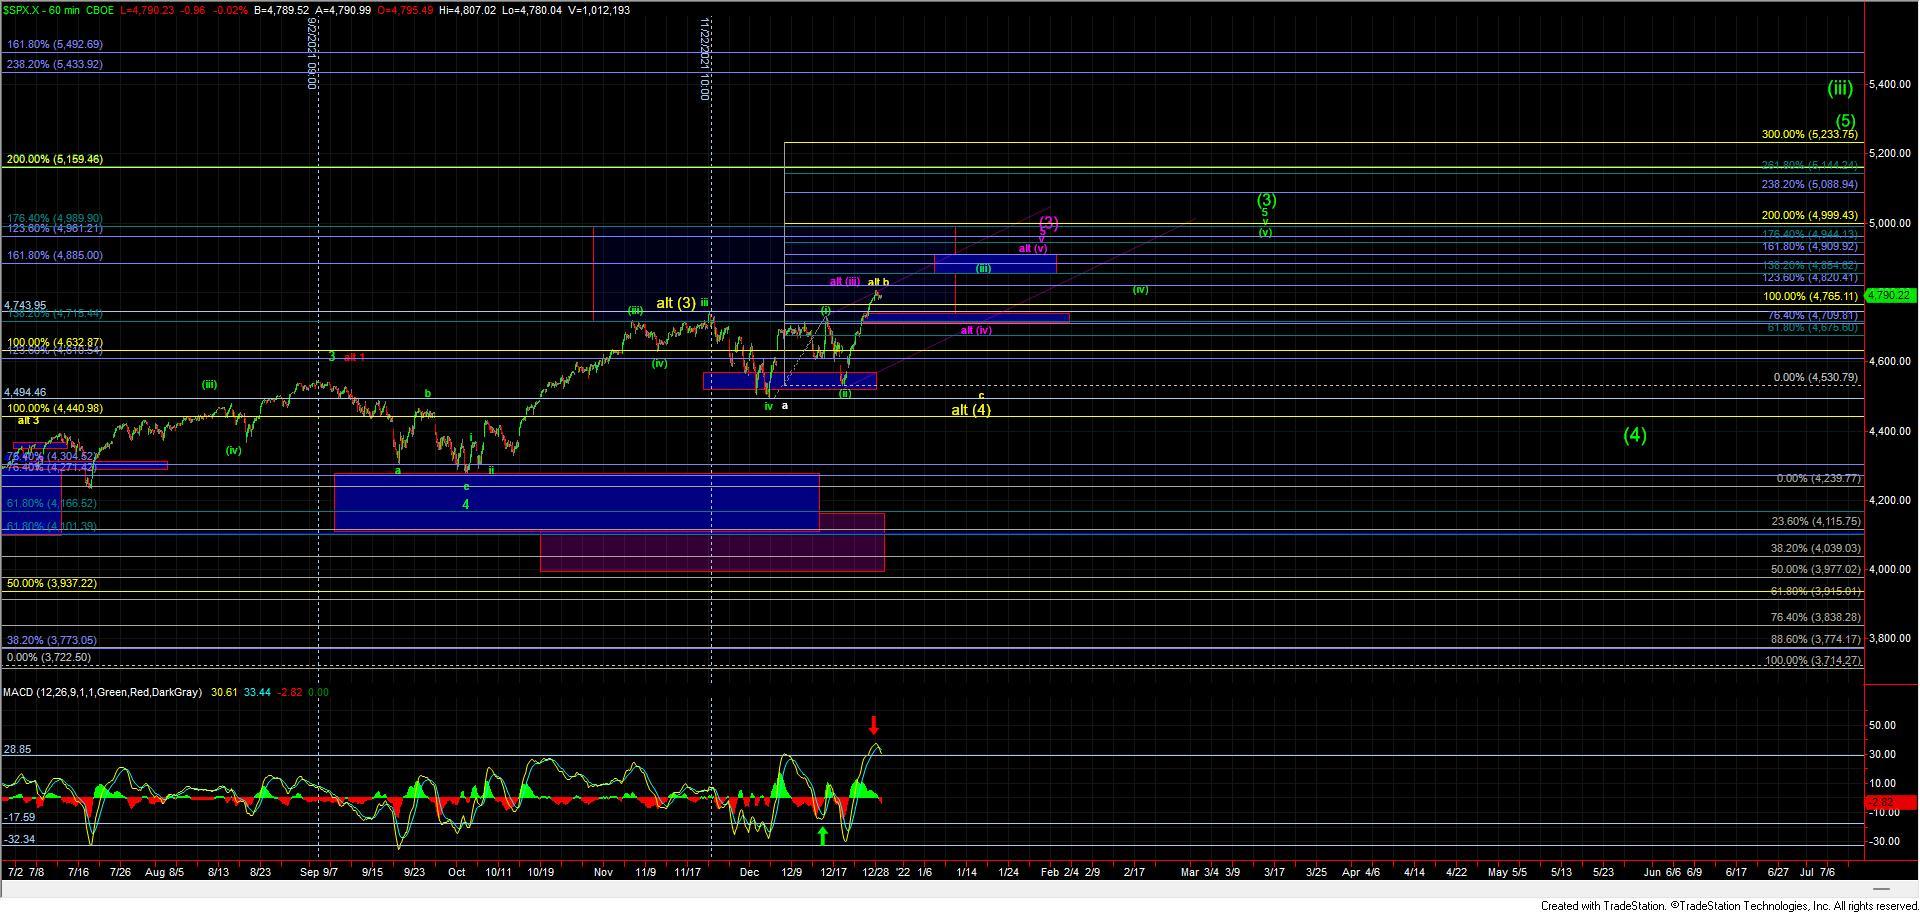
If that support zone were to break then it would open the door to this having put in a larger degree top as shown in yellow or purple, which I have added to the charts as of this update. The yellow path remains unchanged from the previous updates and would suggest that this move to new highs is an expanded or running b wave still needing another push down for a wave c of (4) before finding a larger degree bottom and pushing higher once again. For this yellow path to trigger, we would need to see a full five down off of the highs AND a break of the support zone laid out above. Unless and until we see that occur then it is unlikely that we are following this path.
The purple path that I have added to this chart would still need to see the five-wave move up off of the December lows fill out towards the 4900 area however under this case the path would take a more complex ending diagonal pattern vs. that of an impuslve five-wave move. If we were to break the 4692 level but do it on a clearly corrective wave structure then I would likely adopt this purple path as the base case. Again this purple count would still need another push up towards the 4900 area but it would take a more complex and less direct path towards that zone before ultimately topping in that larger degree wave (3).
While I have laid out the alternate paths shown in both yellow and purple as of the time of this writing those are just that, alternate paths. We lay them out so that we can be prepared and not caught flat-footed should our primary path not follow through. In this case, the primary green count will remain the base case as long as we are trading over the 4692 level. Should that level break we do however have the parameters in place in which to track accordingly.