Markets Still Mixed - Market Analysis for Mar 24th, 2021
 By
By
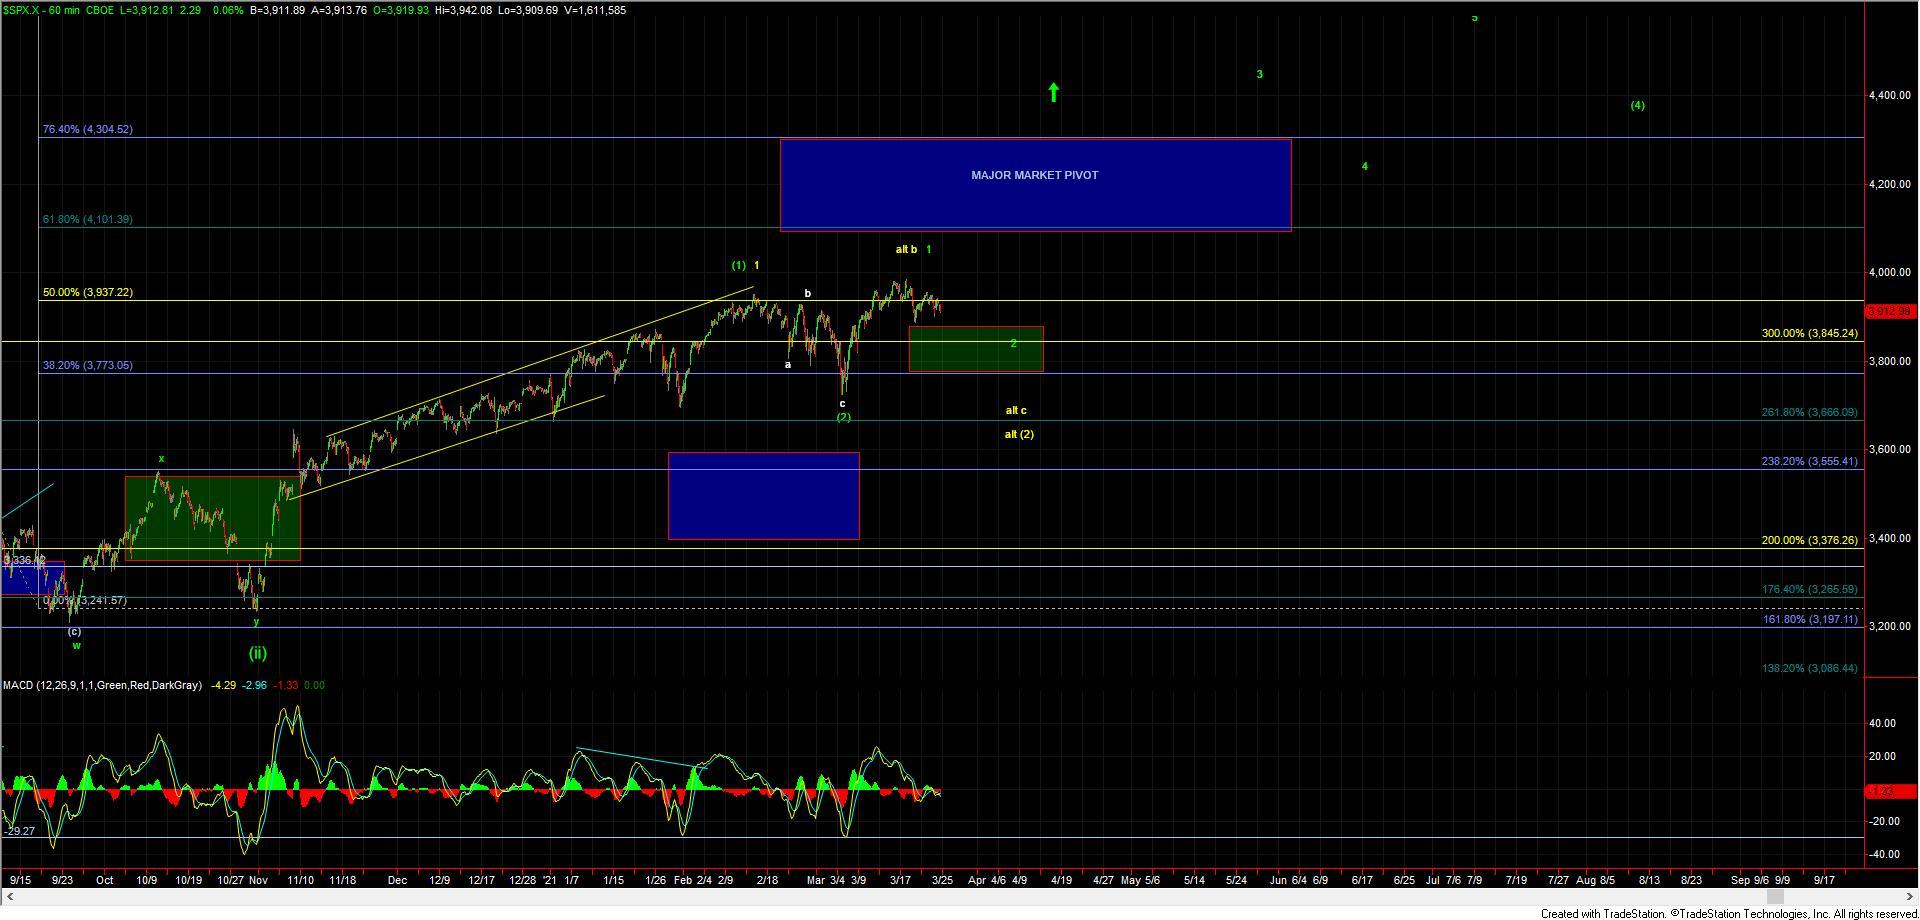
Today we saw the SPX continue to bounce around in the same region that it has been trading in for the past several weeks failing to give us any real resolution to the paths that we have laid out during the last several trading sessions. We also saw another day of divergence between the major indexes with the Nasdaq and Russell 2000 trading down today while the SPX is still trading in positive territory as of the time of this writing. So with that, the parameters that Avi laid out in last night's update in regards to the SPX all still remain very much intact today here as the market continues to bounce around over the 3850 level and the previous all-time highs. I will note however that while the SPX is still meandering in a bit of no-mans-land the Nasdaq and Russell 2000 both have patterns that are better defined and are both quickly closing in on near-term support levels.
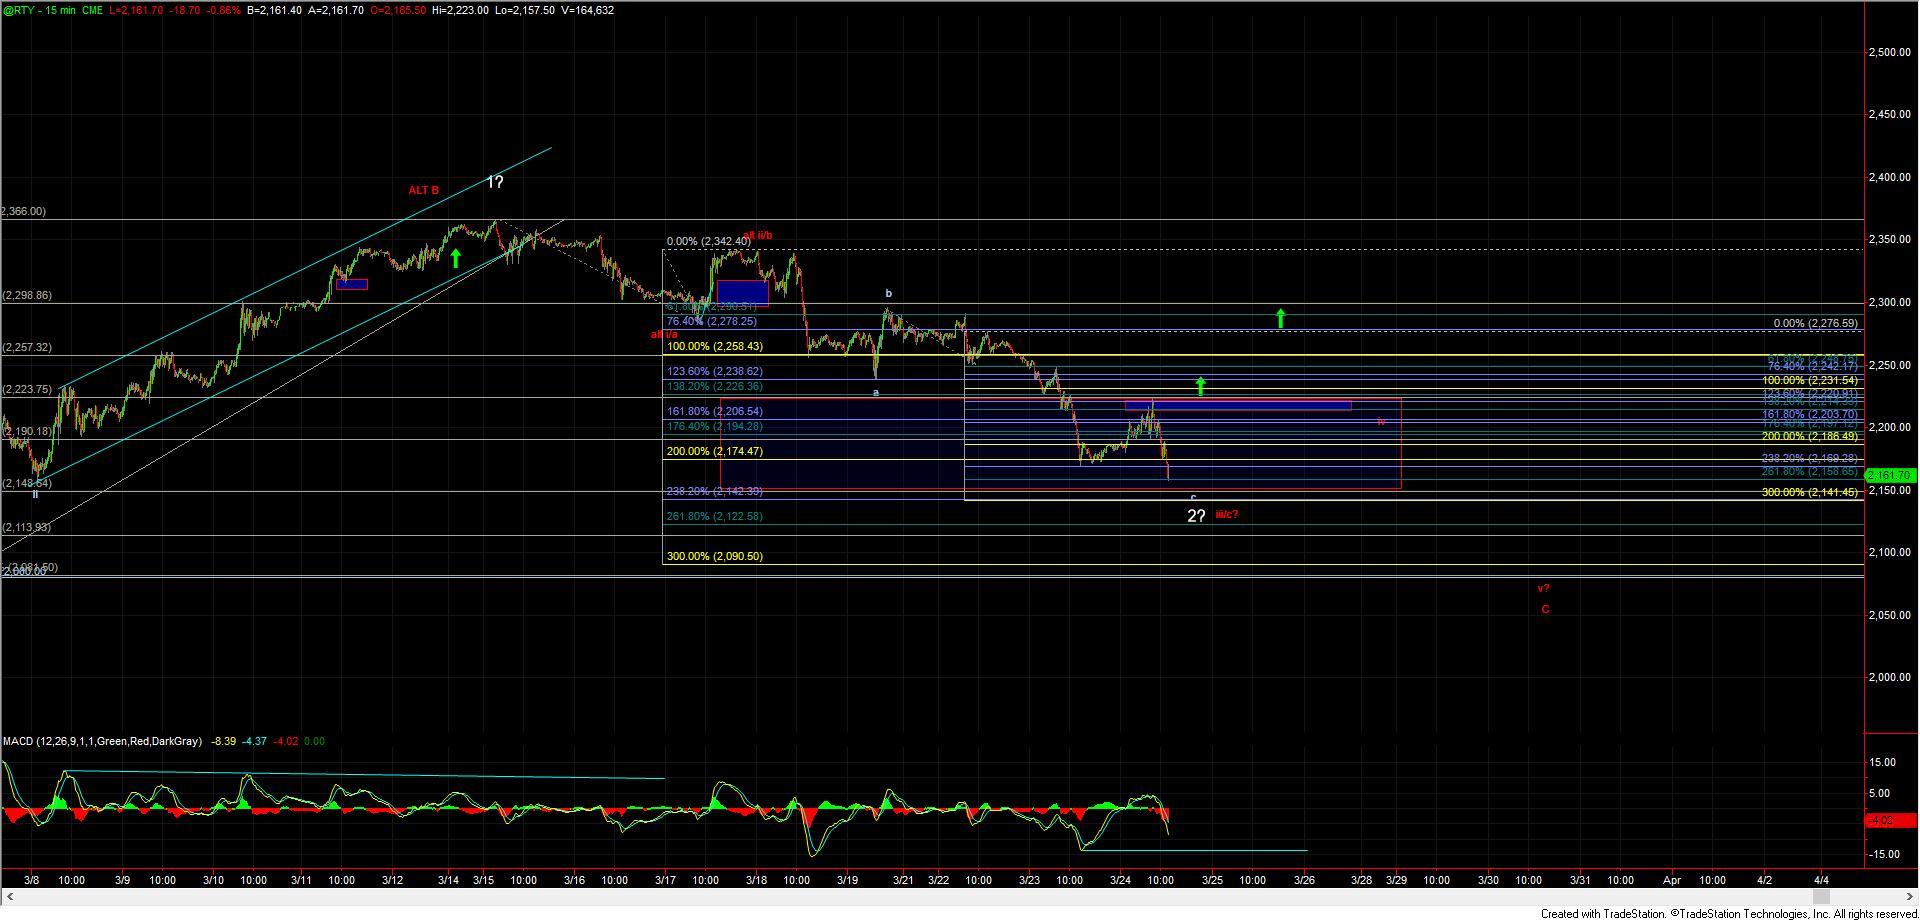
The Russell 2000 futures (RTY) is now closing in on the 76.4 retrace level from the entire move up off of the March 5th low and is quote oversold on the 1-hour timeframes. This price support at the 2148 RTY level should ideally hold if we are indeed going to find a near-term bottom in a wave 2 of a larger wave v. Breaking this level would open the door to the RUT seeing a deeper retrace that could ultimately take this back down below that March 5th low prior to bottoming.
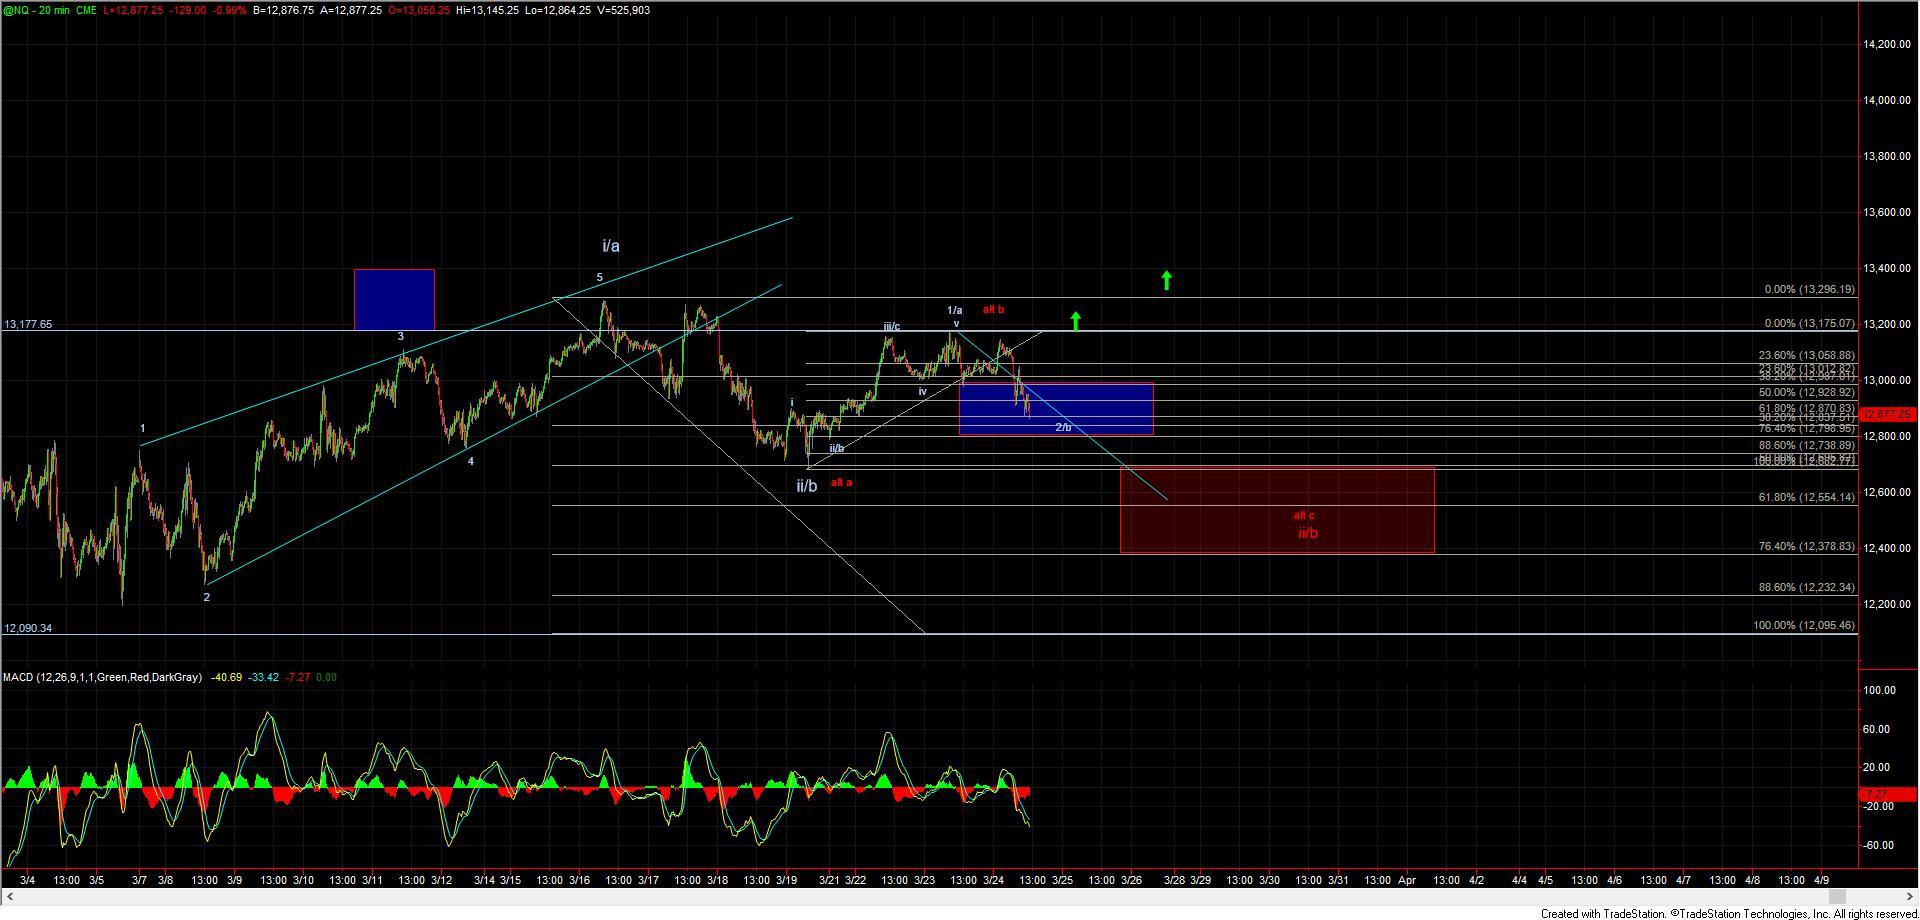
The Nasdaq is also nearing support for a potential wave 2 with it attempting to hold the 61.8-76.4% retrace of the move up off of the March 19th low after already getting what appeared to be a completed five wave move up off of the March fifth low. The key support level that I am watching on the NQ chart currently comes in at the 12,789 level and should we see a break of this level it would then open the door to seeing a deeper retrace that could see this move down toward the 12,500-12,378 zone prior to finding a bottom.
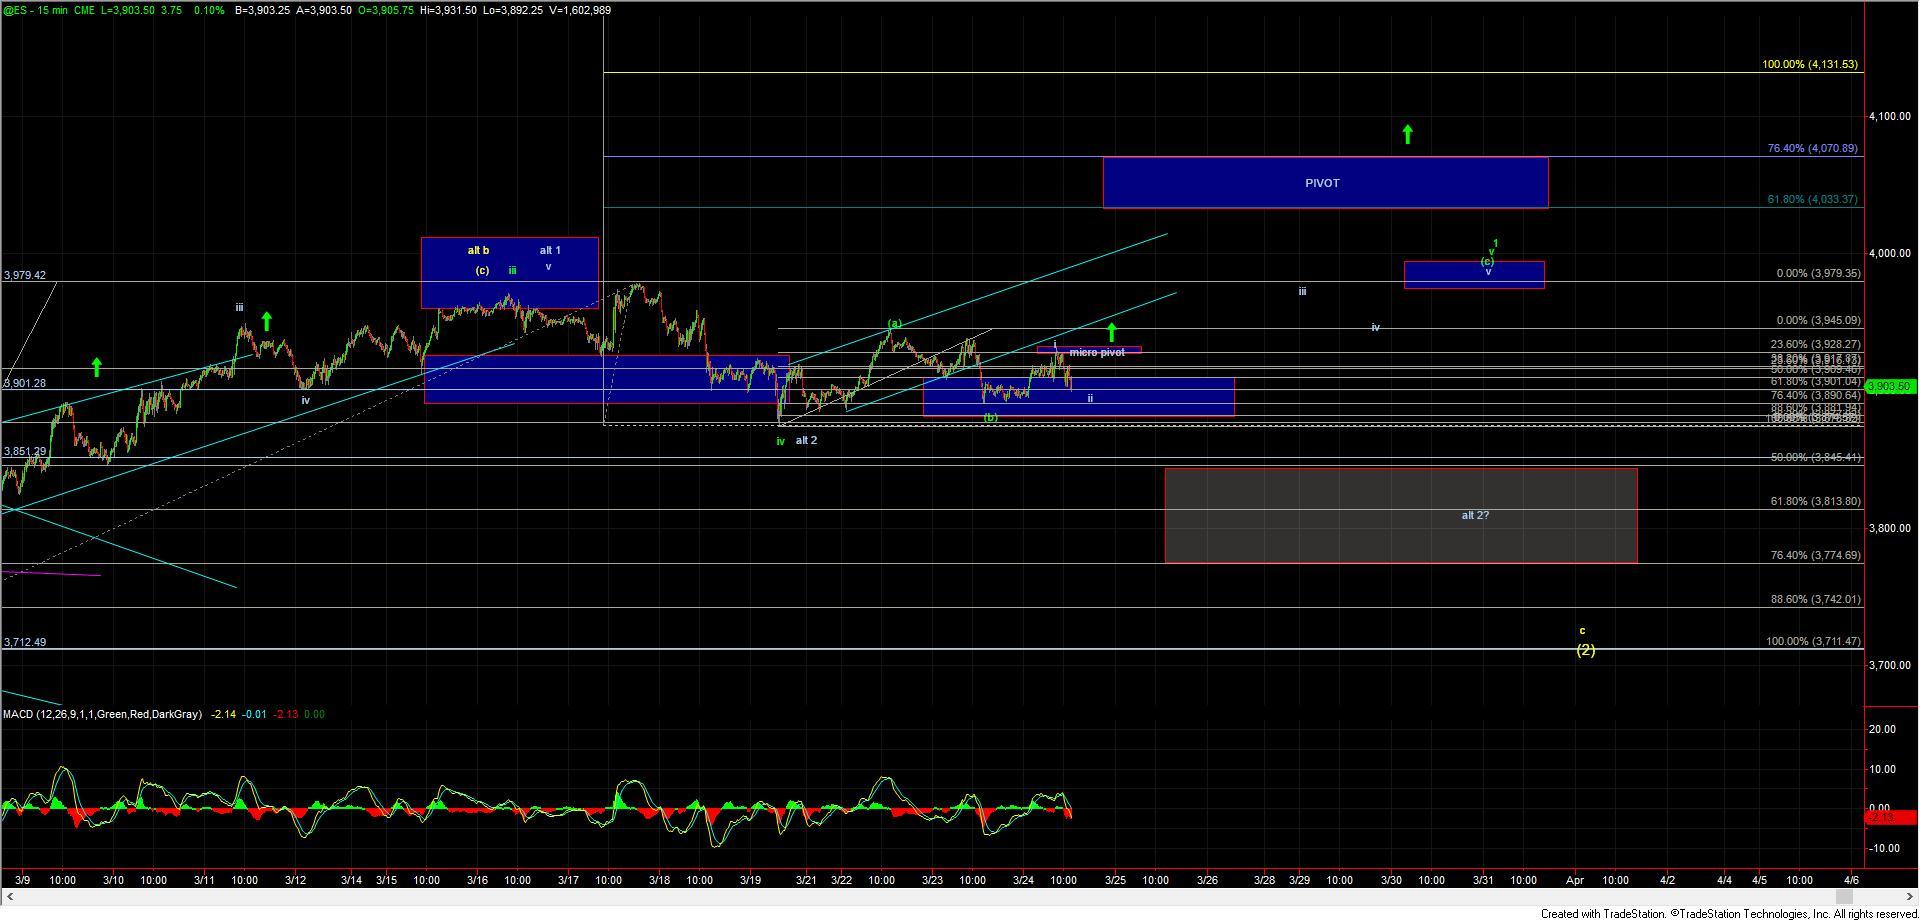
The SPX as noted is a bit more complex and sloppy but still has key support down near the 3850 level. Should we see a sustained break of this level then it would open the door to seeing a deeper retrace back down towards the 3813--3775 zone. A break of that zone would then open the door to seeing a deeper retrace back below the 3712 low as part of the yellow wave c that is laid out on the 60min chart.
So while things are quite unclear here as we near the end of the day all of the major indexes are still holding support at the moment. If we can manage to hold those levels and push higher then it should help clear up some of the uncertainty that we currently have on the charts and potentially set up the next major breakout that we have been watching on these charts. If on the other hand, we begin to see a break of these support levels then we likely need a bit more time for the market to consolidate and before heading to the long-term and ultimate targets overhead.