Markets Stil In A Mess
 By
By
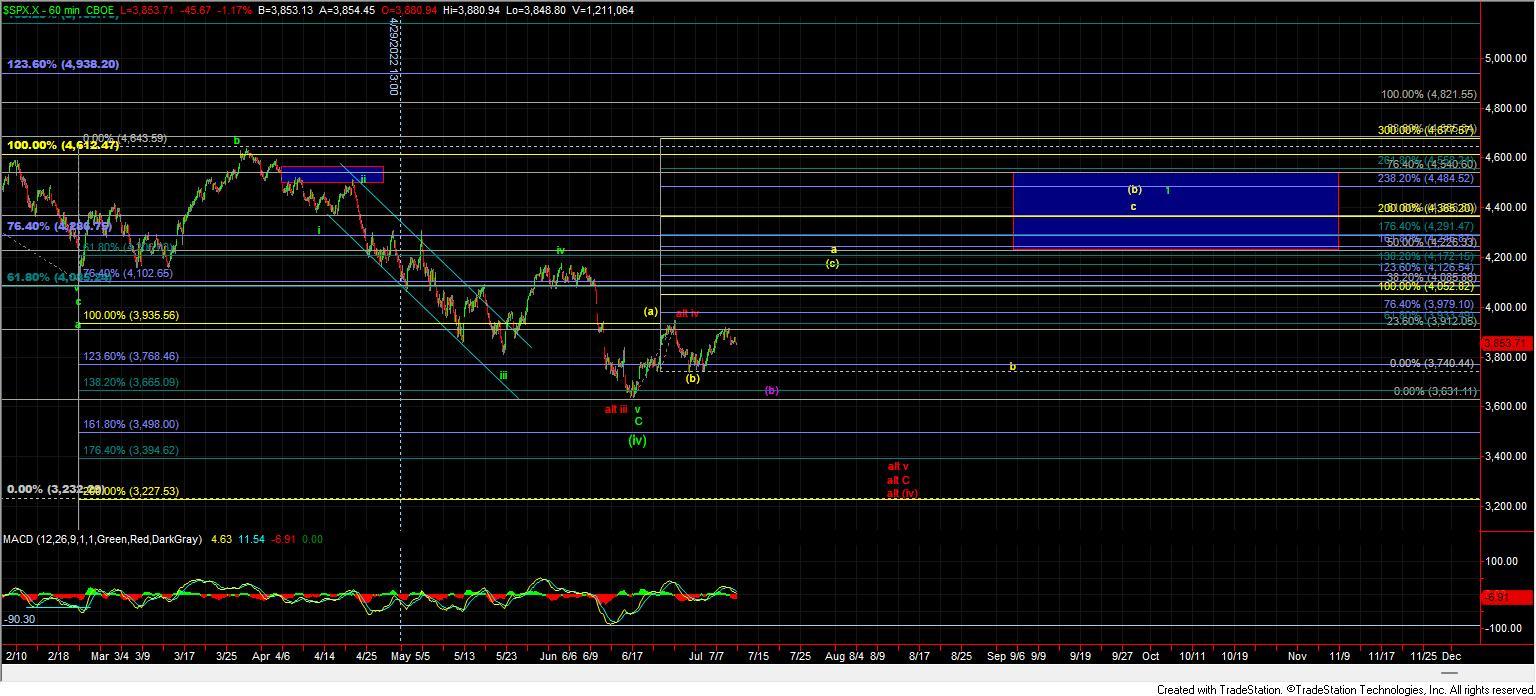
Today the market moved lower and broke down below the support level that I had been watching to keep the yellow count in play as an impulsive wave pattern thus making the purple and red counts more probable. Unfortunately, the action down off of the highs is not terribly clear at this point in time either which while still keeping those downside counts very much in play is not giving us the highest of probability that we will indeed see follow-through under those cases either. So this is leaving us in a bit of a mess here on the smaller timeframes as the price action is still not giving us much to work with in the way of impulsive price action either up or down. So with that, I still remain cautious here and have a very difficult time having a heavy favorite of any of the possible paths that I am watching at the moment.
Yellow Count
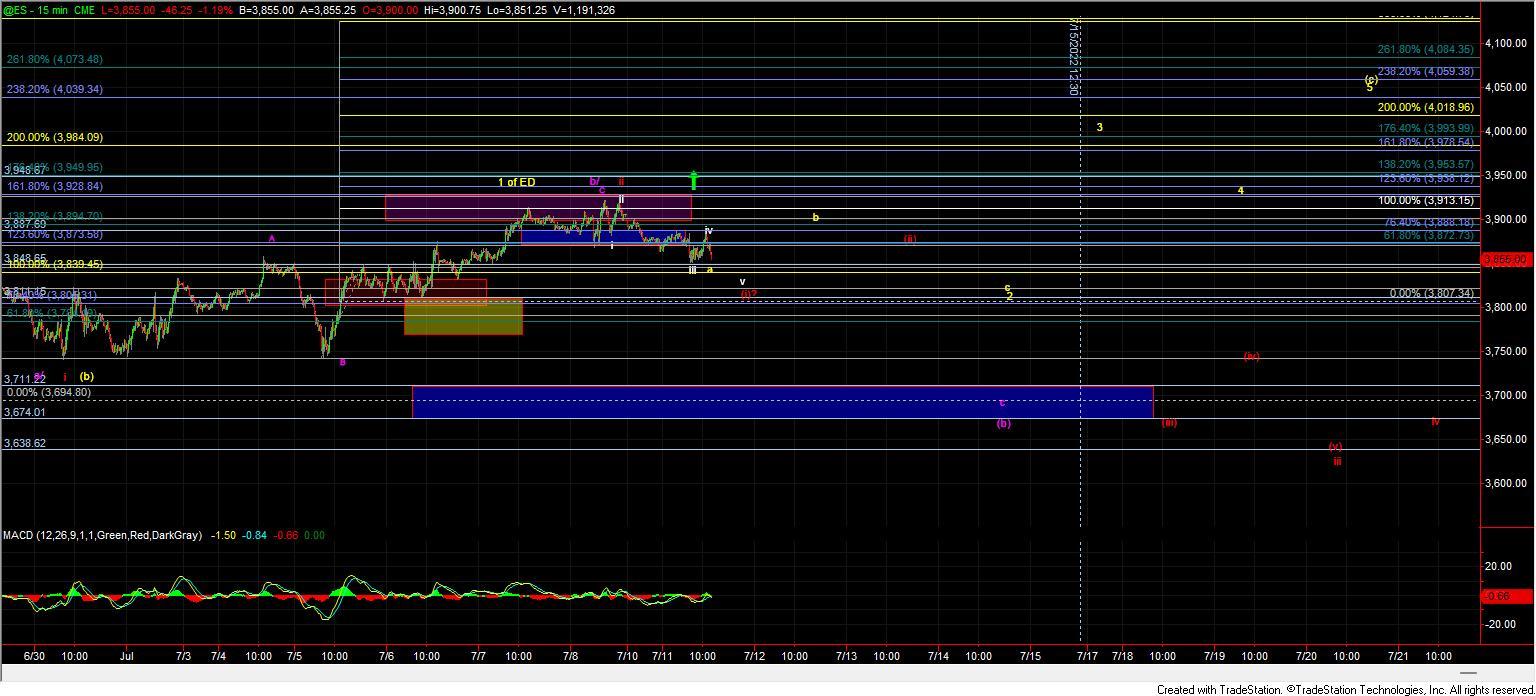
The yellow count has not fully invalidated just yet but at this point, with the break of support, I think if we do follow-through under this case we likely will take the form of an ending diagonal to finally of the wave (c). So under that path I would be looking for a wave 2 to retrace down towards the 3832-3784 zone before turning back higher in wave 3 of c which should then be followed by a fairy deep wave 4 and then another push back higher for a wave 5. Again this would likely be taking the form of an ending diagonal so all of the price action should be moving in three waves which would make tracking the next leg up difficult. Its very early in this potential path and I really do not like projecting Ending Diagonals this early in the pattern but as we do not have a clean five down off of the highs just yet I am still going to allow for this yellow path to play out if we can indeed push to new highs. If we continue to move lower and break the 3784 level then we likely are heading lower in either the purple or red paths which are for the most part the same as what I laid out last week.
Red Count
The red count should be finishing up a wave (i) into today's lows with the larger i-ii would following a very similar path to the purple wave b top. The red count would project back down to new lows under the 3638 level whereas the purple count would hold those levels before turning higher once again. If we do break down below that 3638 level per this red count then we still would be projecting down towards the 3500-3450 zone below but again to open the door to this count we need to start the next leg down with a full five wave move.
Purple Count
Under the purple count instead of making a new lower low towards the 3500-3450 zone we would likey hold the 3712-3674 zone and bottom in a larger wave (b) before heading higher. This path would ideally top out around the 3863-3924 zone before moving lower in the wave c of (b). As noted above this path would start out very similarly to the larger red i-ii but again would not make a lower low and turn higher before breaking the 3639 lows. This may be the most painful path for both bulls and bears so it is one that I am keeping a very close eye on here as we move into the 3900-3926 resistance zone just overhead.
So in the end today's action is quite sloppy and unfortunately not giving us a clear indication of which path this is going to follow so I simply will have to wait to see what the price action looks like over the course of the next several days to see if things clear up a bit or if we will continue to chop around in what has so far been very sloppy price action.