Markets Seemed To Avoid The Most Dangerous Path For Now
 By
By
Yesterday we saw the market push higher into a key resistance zone which I had noted was a "Danger Zone" on the near-term charts when we were trading at the 3858 level. Before the market closed we saw the market drop sharply some 50 points before retracing overnight and then moving down another 50 points opening today 100 points lower or 2.5% from level that we had hit at the time of yesteday's update. This sharp drop lower had opened the door to this moving sharply lower as an impulsive wave pattern in both the purple and red counts however at the open we had still yet to see a sustained break of the support level needed to confirm a direct path lower for these paths and we were still holding the key support level that I had laid out for the yellow count. During the morning session see saw a pus higher off of that support level and through a key downside pivot which provided the bulls a bit of relief as it invalided the most immediately bearish and impulsive path lower making the red count much less probable. We are however still note quite out of the woods in regards to seeing nothe minor lower low under the purple count but if we do see that low the purple path will now likely take the form of an ending diagonal thus making the depth of this drop not nearly as deep as the projections that had been in place before today's rally. So while today's action is still far from clean it did take quite a bit of pressure off of the count that would have this projecting down to a push back under the 3638 low.
Yellow Count
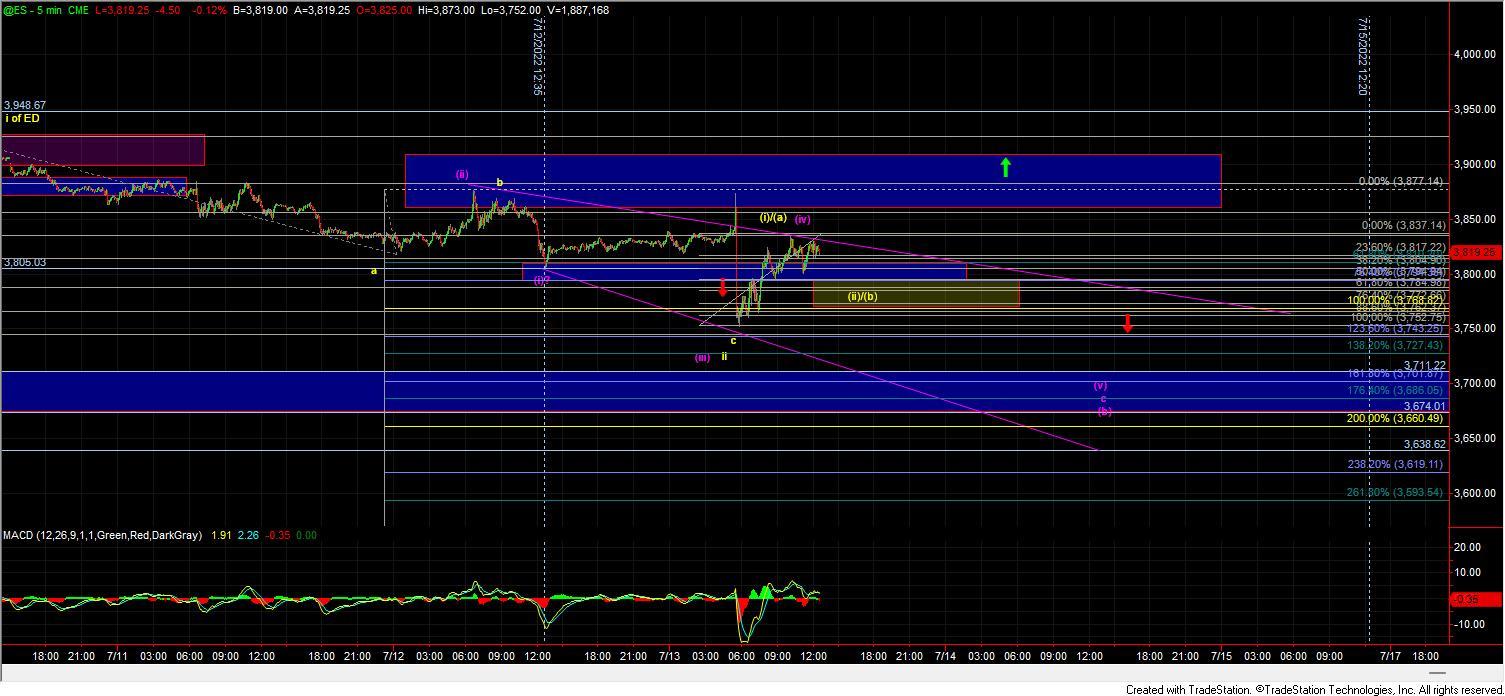
I am still counting this as being in part of an ending diagonal up off of the lows to finish off the wave (c). Under this path the wave 2 should have bottomed today just under the 3784 zone and we should now be in part of the wave 3 up. Keep in mind that because I am counting this wave yellow wave (c) as an ending diagonal the intail move up off of the lows does not have to take the form of a five wave move, although that would be preferred. The action up off of the lows does count best as a five wave leading diagonal, which while not the most reliable can still very much keep this yellow count pushing higher so long as we hold over support. That support zone now comes in at the 3784-3772 zone. If we can hold that zone and push higher back over the 3877 level then we will have initial confirmation that we are indeed following through under this yellow path higher to fill out the wave (c) up off of the lows. Now I do want to warn that even if we do push higher under this case the path is likely going to be sloppy as we would be dealing with three wave action to fill out what I see as moving higher as an ending diagonal for the wave (c). If we move under the 3772 level then it would open the door for the purple count taking this back down to see another lower low before finding a bottom.
Purple Count
WIth the push back higher today we now have overlap between what I would count as the wave (i) and (iv) of c of (b) under the purple count. So with that, I would likey have to count this wave c as following through as an ending diagonal to the downside. Under this case, we should ideally hold around regular hours HOD and then move lower under the 3772 level and ultimately back under the 3752 low to finish off the pattern. Support for the wave (b) under this case remains in the 3711-3674 zone but with the ED count now in place, we could simply hit the upper end of that zone before turning higher again in the larger wave (c) up.
Red Count
As noted above the red count is much less likely with this action and it would take a very ill-proportioned series of nested 1-2s to the downside to make this path viable which I am not seeing as highly probable at this point in time. I will however leave the count on the charts for now as long as we are able to hold under the 3877 level on the ES which would be the official invalidation point.
So while today's action did not officially invalidate any of the counts we have been watching I think we can reasonably narrow this down to two with the red count being an outside possibility at this point in time. That being said with what still looks like three-wave action in both directions I think we may still see the market give us some sloppy wave action over the next several weeks even if we do indeed push higher. We do have our parameters in place however which should continue to give us some guidance in what remains quite the mess of a market.