Markets Remain Overbought As They Continue To Push Higher
 By
By
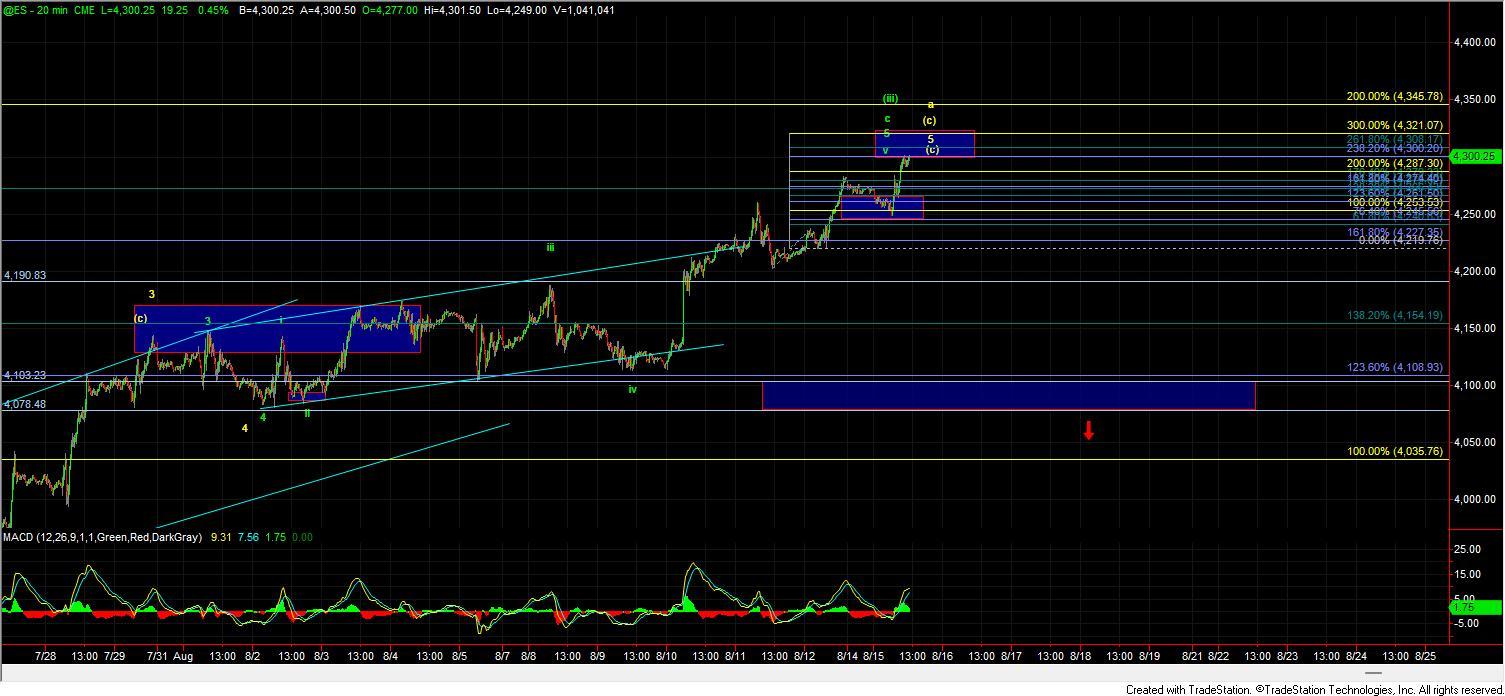
Today the market opened lower but found support for what appeared to be a very micro fourth wave and then pushed higher towards the 4300 level. This push has given us yet another potentially completed pattern into what is now the 138.2 ext of the initial wave a up off of the 3720 low. This 4300 level also has some fib confluence on the smaller degree fibs as shown on the ES chart as this level represents the 238.2 ext of the move up off of the August 11th low again giving us a potentially full pattern even down to this very small degree timeframe. Furthermore, the MACD on the daily chart is quite overbought as it is now approaching a level from which we have seen pullbacks from since the lows that were struck in March of 2020, and the 60min MACD is still forming negative divergence on this current push higher. While all of the ingredients are in place for a top until we see an actual break of support and/or a full five-wave move to the downside we still do not yet have confirmation of a top however with a lack of a full five up off of the lows and a pattern which still is suggestive of a larger degree diagonal up off of the lows I still remain cautious in this region and await a pullback for the wave (iv) and push higher for the wave (v) to set up an ultimate push to new all-time highs. Should we fail to hold support for that wave (iv) then it would still open the door for this to be forming a larger ABC up off of the lows per that yellow count which would see this still see a much deeper retrace as has been laid out per the yellow count. Other than that there really is not too much to add to what we have already laid out in regards to the charts and I still am watching both the yellow and the green counts over the past several weeks.
Yellow Count
As noted previously the Yellow count would suggest that we are following an ABC up off of the June lows with the wave (c) of that ABC coming into completion near current levels in the form of an ending diagonal. As it is typical for the reversal out of an Ending Diagonal to be quite sharp back to the origination point if we are indeed following this yellow count I would expect to see a sharp move lower that ultimately targets the 3736 level below. I would want to see this move below the 4000 level followed by a break under the 3960 level to give us confirmation that we have indeed topped in this yellow count. Again this should be a fairly swift reversal to the downside under this yellow count so If we do break under the 4000 level but see a more muted move down then I think it would become more probable that we are following the green wave (iv) retrace.
Green Count
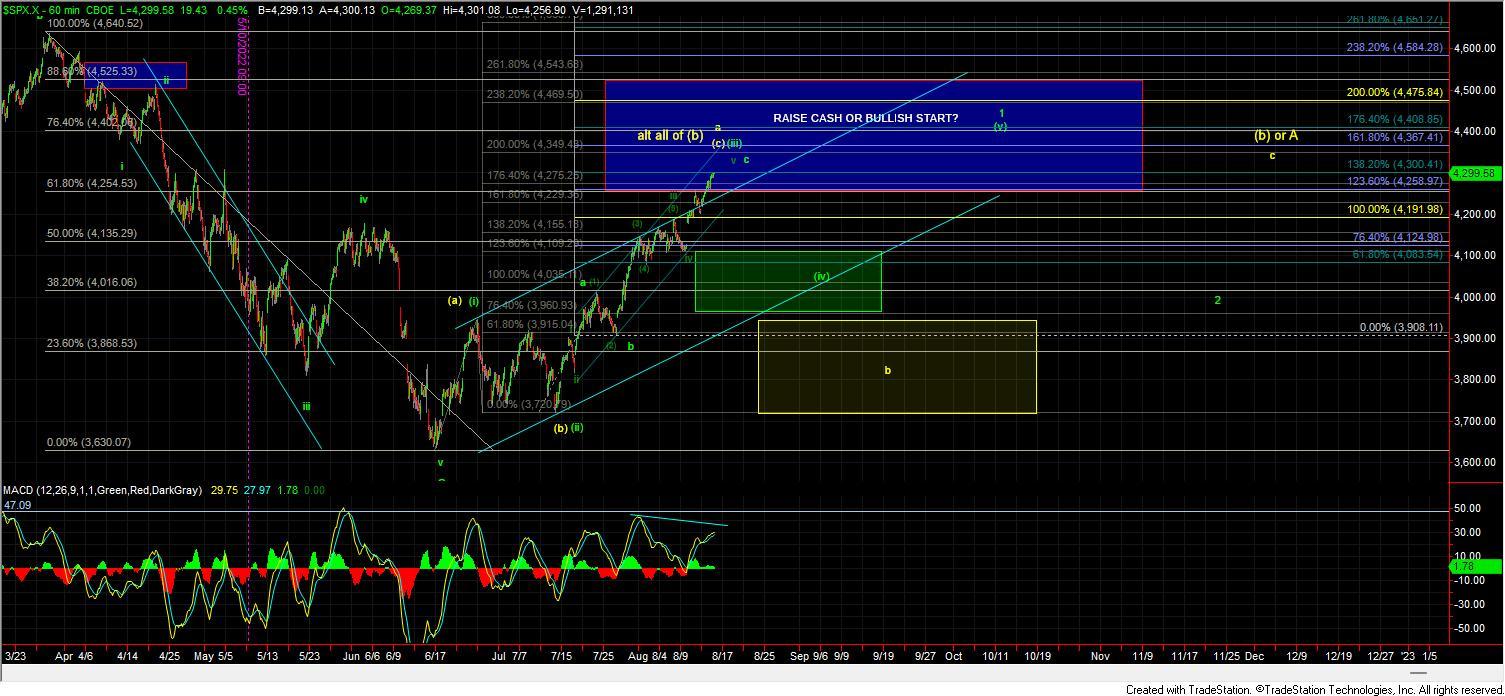
Under the green count, we should see a pullback towards the 4124-3960 region and that pullback should take the form of a three-wave move. We should however see another higher high back over the current high to complete a potential leading diagonal up off of the lows. The initial move down off of the highs will likely be very similar to that of the yellow count but again the drop will not be nearly as sharp or deep before turning higher once again. Additionally, once this does bottom in the wave (iv) the final leg up for the wave (v) of 1 is likely going to give us more sloppy action as it should take the form of another three-wave move to fill out the last leg of the leading diagonal. I will note that with this continued push higher I have moved support up to the 4124-3960 region up from the 3950-3900 zone that I had been watching previously. Otherwise, this count remains the same as before.
So in the end, while we have continued to extend higher in this third wave very little has changed from a count perspective as we are still trading with three waves up into this current larger degree resistance zone. If and when we get a full five up as laid out per the green count then we will have a much higher degree of confidence that this is ready to take off to new all-time highs giving us the potential for a very strong 2023 in the equity markets. For now, however, I will remain patient and wait for the pattern to fully develop as we move into the later part of this year.