Markets Pull Back But Downside Risk Still In Place
 By
By
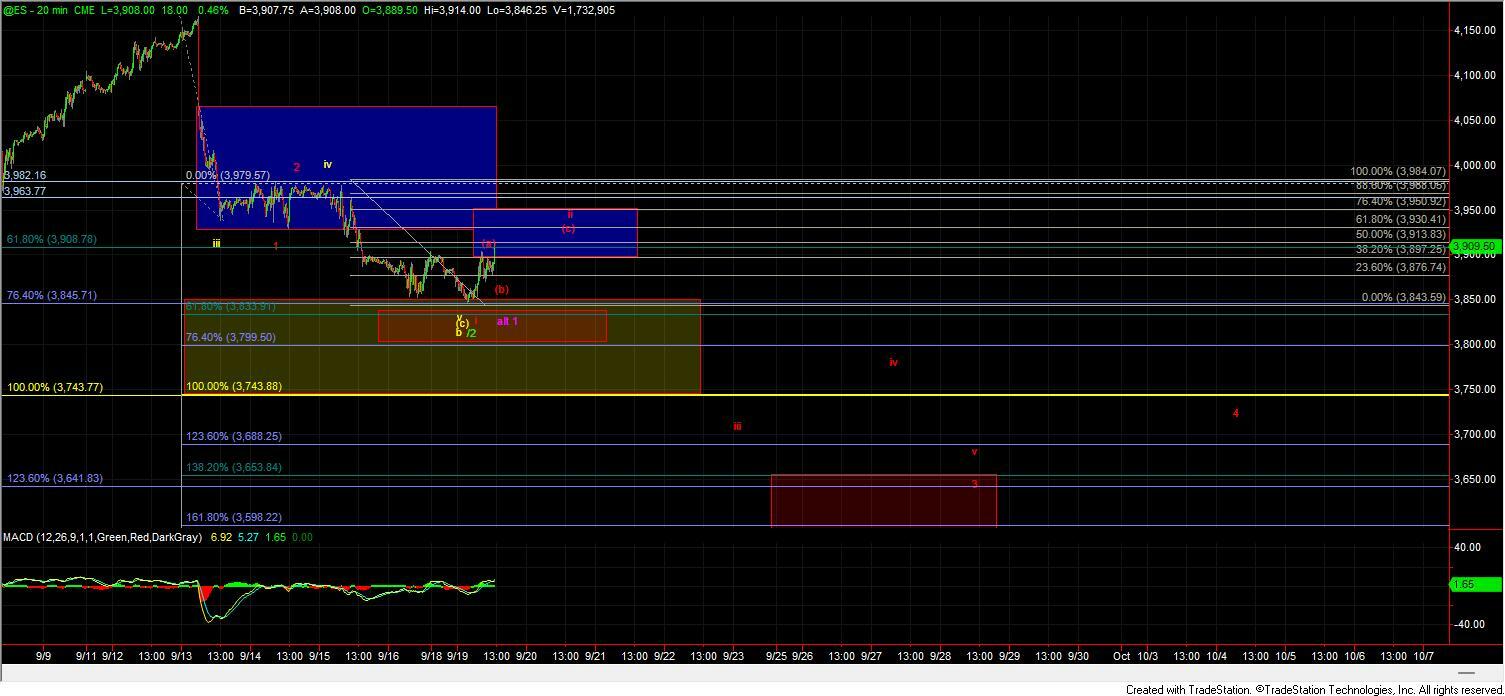
After moving down overnight completing what is a fairly clear five-wave move down off of the 3979 high, we saw the market retrace higher after hitting the upper end of the pivot zone for what can be counted as the wave i of 3 under the red count. This retrace is so far suggestive that we are indeed following the red count as it occurred exactly where we would expect the wave i of a larger wave 3 down to occur under our fib pinball guidelines. So with that and as long as this continues to hold under resistance I have to give the benefit of the doubt to the red count continuing to follow-through lower as part of an impulse for the larger wave c down off of the highs.
Red Count
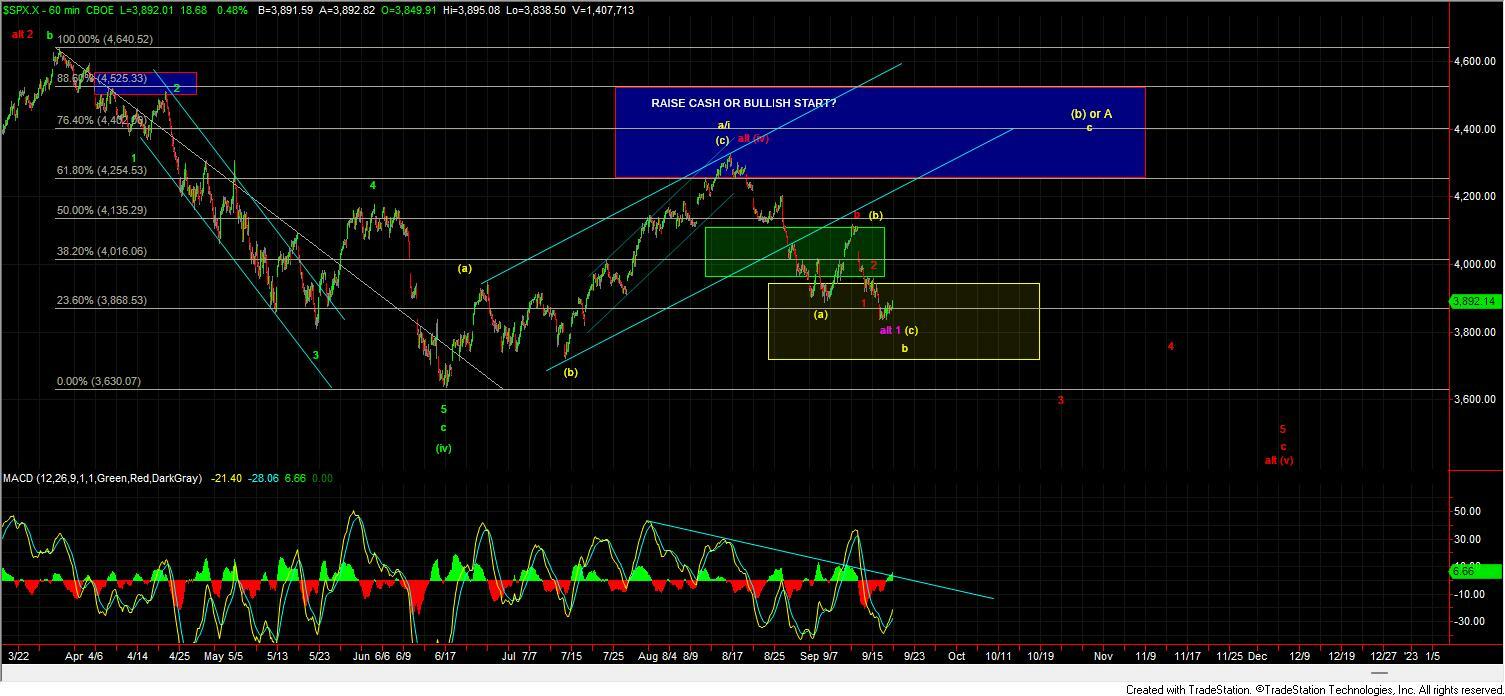
Under the red count, we should hold under the 3897-3950 zone. This represents the 38.2-76.4 retrace level of the move down off of the 3984 high which is the standard retrace zone for a wave ii in Elliott wave. Assuming we can hold that zone we should see a turn back lower in the form of five waves that would then need to break back below the 3833-3799 pivot zone below followed by a break under the 3743 level. Moving through those levels would then clear the way for a move down into the 3653-3563 zone for the wave 3 of c with the ultimate wave 5 of c targets closer to the 3508-3362 zone below. If we were to see this break back over that zone followed by a break over the 3979 high then it would open the door for this to have put in a larger degree bottom in either the purple or green count.
Purple Count
The purple count would suggest that we are bottoming in a larger wave 1 needing a deeper retrae for a larger wave 2 of c down. There are several issues with this count in regards to the structure of that wave 1 however if we move over the 3979 high on corrective wave action I am still going to leave the door open to this path however it is far from ideal thus making it a lower probability alternate path.
Green/yellow count
The green and yellow counts are going to trace out very similarly in the early stages and it will be tough to differentiate them which is why I am combining them into one narrative for the time being. Under this case, we would should move back up over the 3979 high and then ultimately back over the 4135 level on its way back up over the highs that were struck in August. That move would then either be the start of a wave iii as part of a diagonal to new highs under the green path or as part of a larger wave (b) as I am showing in yellow. Again the early part of this move is likey to be similar so at this point I am going to combine the narrative to try to keep things a bit more simple.
So while the corrective wave action on this has been quite sloppy we do have some fairly clear parameters over the next several days as we do have a potential impulse down per the red count. Whether or not we are able to hold the parameters laid our per that count will tell us whether or not we are going to follow the more straightforward downside path to complete this corrective wave pattern or if we are going to follow a more complex pattern over the course of the next several weeks.