Markets Move Sharply Lower Once Again But Fails To See Final Follow Through Into The Close
 By
By
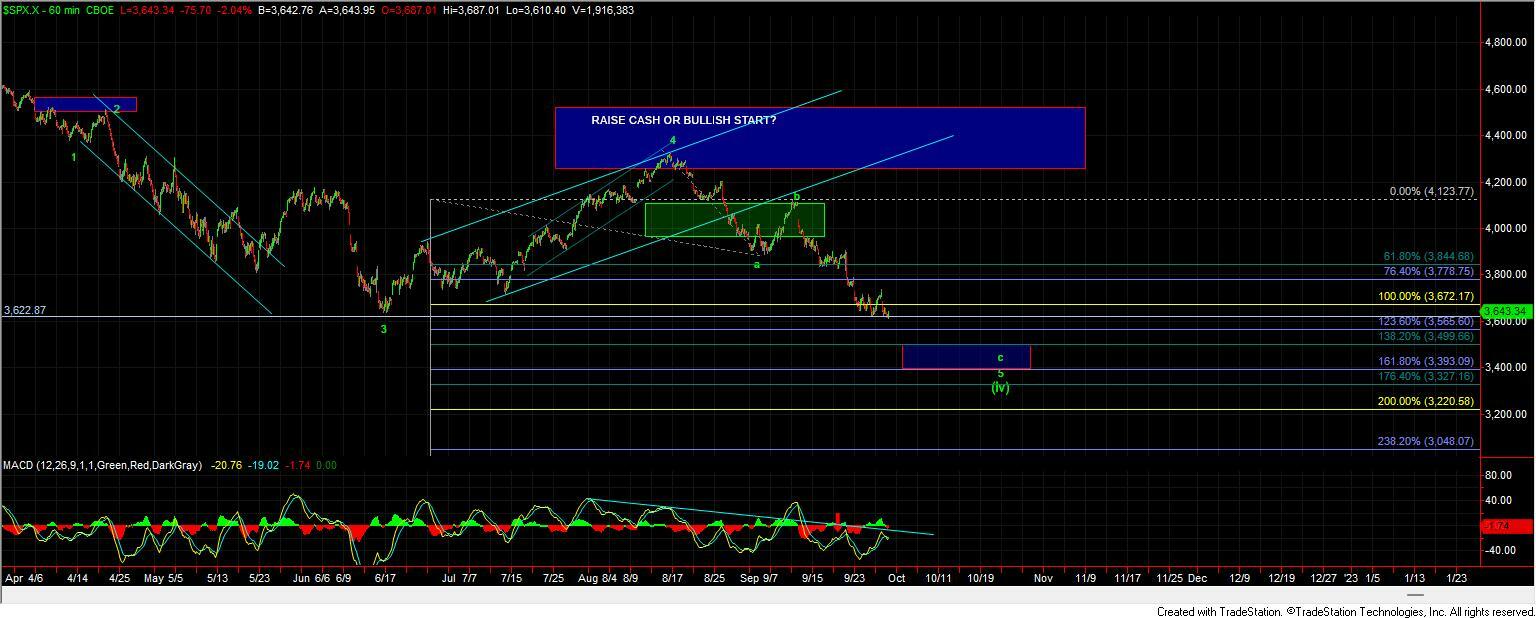
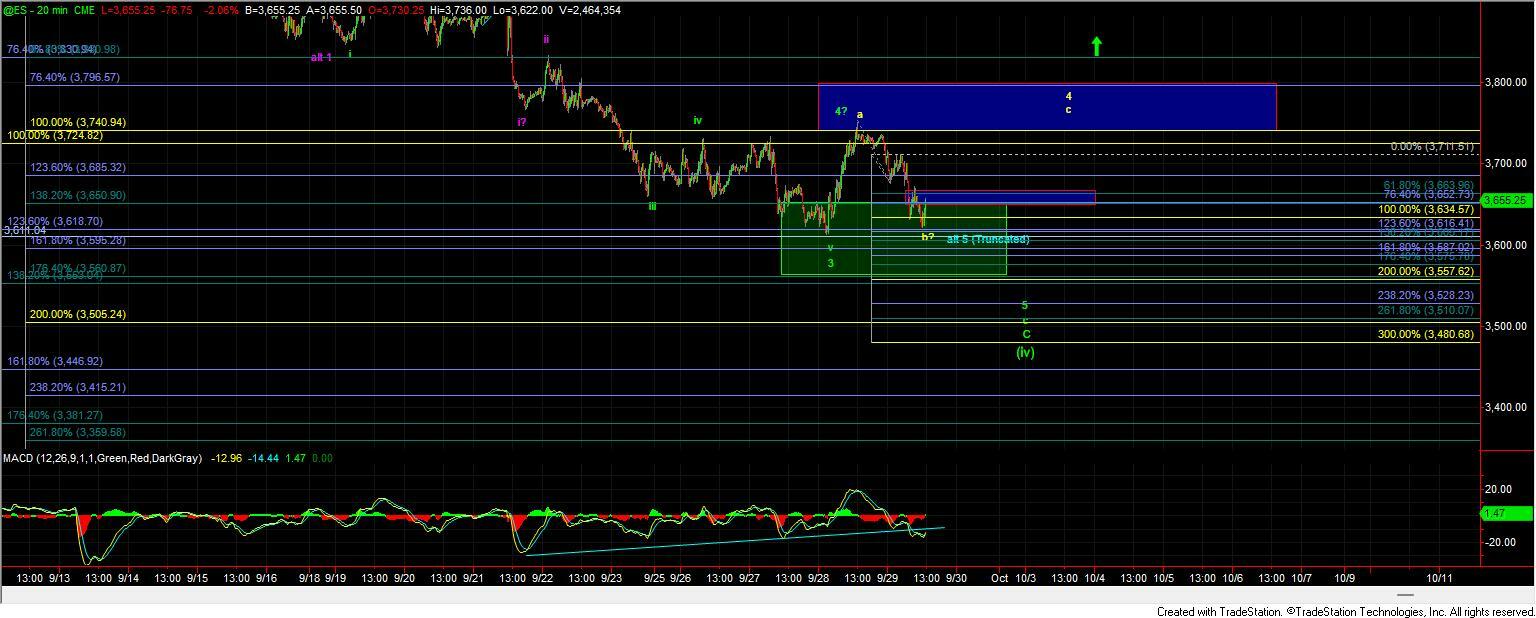
Yesterday we saw the market push sharply higher into the key overhead resistance zone that we had laid out in the charts last week. Today we saw a failure at that zone with the market moving sharply lower this morning. This sharp move down opened the door for the market to have topped in all of the wave 4 as we have laid out in green on the ES chart. We have yet however to break the previous low on the ES which is keeping the potential for today's low of the day to still be wave b of that wave 4 still needing yet another push higher back towards yesterday's highs before turning lower once again to complete the larger wave c of (iv) back under the 3611 low. Complicating matters a bit is the fact that the SPX cash chart has already broken Tuesday's low which removes the potential for that low to have been the bottom in all of the wave 5. So with that the only way to count all of the wave 5 in place per the blue count would be to count today's low as a truncated wave 5 on the ES and standard fifth wave in the SPX. This count has several issues which makes it hard to rely on. So with that and for that reason, I think the odds of this still seeing yet another lower low are fairly high at and will remain that way as long as we are trading under the 3765 level overhead, the bigger question at the moment is whether we will see a trip back up towards yesterday's highs before that lower low is seen or whether we will take a more direct path down to new lows before finding any sort of bottom.
Green Count
Under this count, we should now ideally hold the 3652-3663 zone overhead and then break back down below the lows that were struck today at the 6322 level. After breaking then we have the next key fibs below at the 3553-3446 zone below which represents the 138.2-161.8 ext of the wave a down off of the August highs. From that point, we would then want to see a push back up over the 3740 level to give us confirmation that we have indeed put in a bottom in the wave 5 of c. If we are able to break out over the 3663 level prior to breaking down to a new lower low then it would give us the initial signal that we may have already put in a local bottom per the yellow count.
Yellow Count
Under the Yellow count we would be making a local bottom in a wave b of 4 still needing a wave c of 4 back up towards the 3740-3796 zone before turning lower once again to finish off the wave 5 of c of (iv). If we push higher and breakout over the 3796 level then it would open the door for this to have put in a truncated bottom on the ES for a wave 5 as shown per the blue count.
Blue Count
The blue count is the same as the green count except it just suggests that we have already put in a bottom in all of the wave 5 of c of (iv) in truncated form on the ES and standard lower low on the SPX. While far from ideal as the move down into the lows on the ES still very much counts better as only being three waves so far if we are able to break out over the 3797 then I would allow for all of the wave 5 of c to be completed at the low of the day.
Purple Count
I am still leaving this purple count on the charts for now but as I noted yesterday based on how the price has reacted at the fibs I think this count is much less likely at this point in time. This count would ultimately move deeper than the green count as the initial wave 1 would be larger than the red count but again I am viewing this as a lower probability path at this point in time.
We still are following our fib pinball guidelines very well as part of an impulsive wave c into the current levels. The final stages of this move are certainly more difficult than what we have seen up until this point. With that being said based on the price action I am seeing right now I am still learning towards seeing yet another lower low with the question more being if we take a direct path to those lows or a more indirect path by moving back up towards yesterday's highs before moving lower once again.