Markets Likely Has Some Unfinished Business Overhead Before Its Ready For A Pullback
 By
By
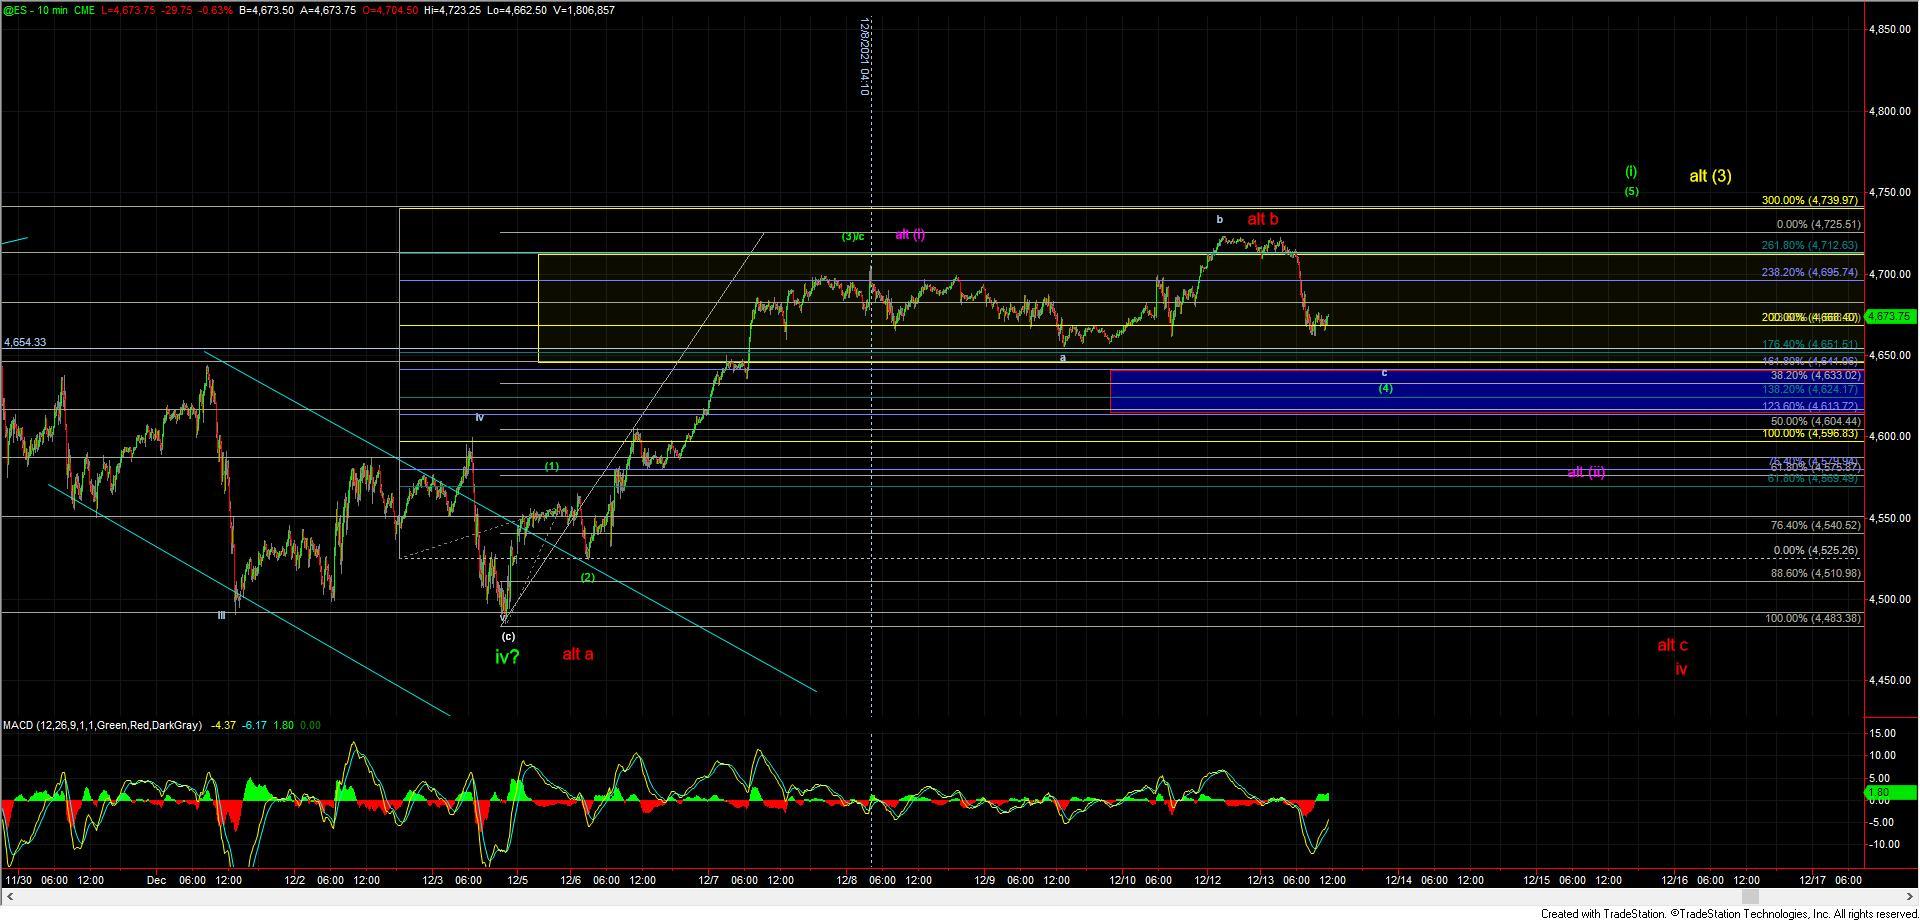
We saw the market push higher overnight seemingly on its way to finish off our wave (5) of (i) per the green count as shown on the ES chart. Completing this five-wave structure off of the 12/3 low would have given us the next level of confirmation that we have indeed put in a bottom in the larger degree wave iv thus setting up a potential strong push up towards the 5000 area over coming months. While we did see a push to new highs over the 12/8 high the structure of the move up off of Friday's low came in the form of a fairly clear three-wave move.
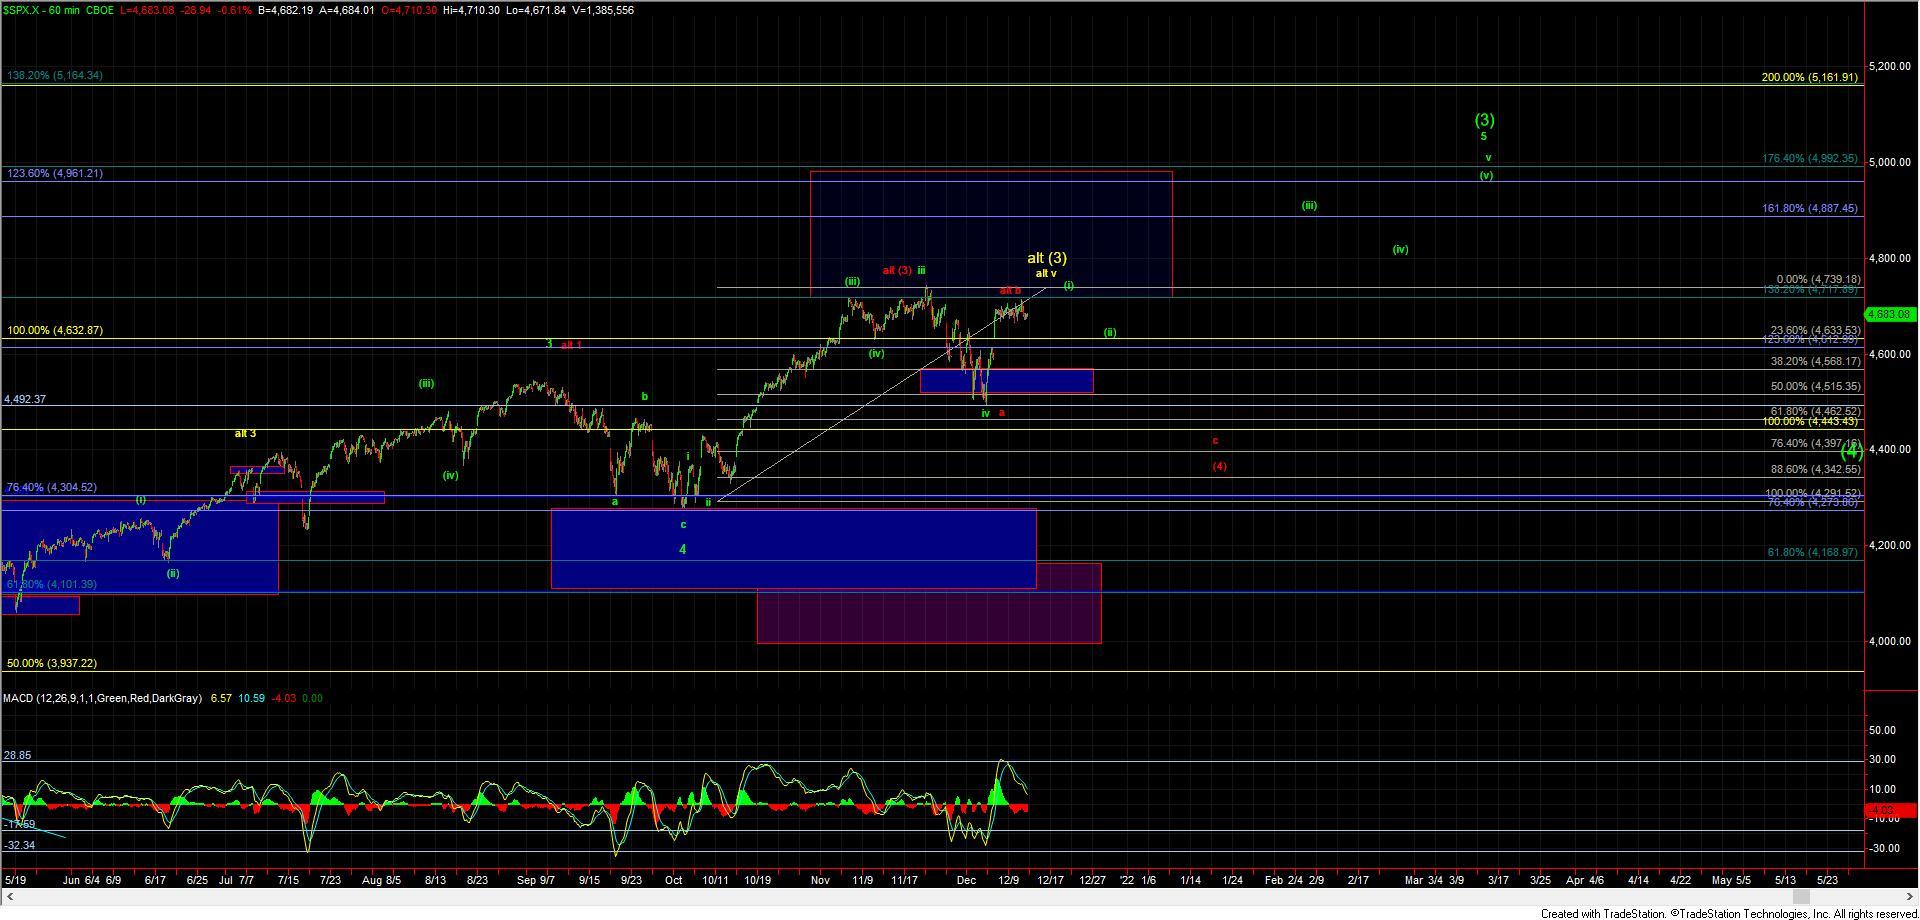
So with that, it's very difficult to consider today's high as the top of our wave (i) as we do not have a clear and proper five-wave move off of Friday's low to complete the pattern. Furthermore, the same push off of the Friday low on the Nasdaq did not exceed the previous high giving us further evidence that today's high in the ES and SPX is simply a wave b taking the form of either an expanded or running flat to finish off the wave (4). So with that, I am once again keeping an eye on the 4644-4613 zone on the ES as key support for the wave (4) and will be looking for that zone to hold before giving us another push higher to finish off the wave (5) of (i). From there I would then be looking for a pullback for the wave (ii) before breaking out higher once again to finish off the larger wave v of (3) as laid out in green on the SPX 60min chart.
If we begin to break below the 4613 level then it would open the door the wave (i) having put in a top at the high that was struck on 12/8. This would make today's high the wave b of that larger wave (ii). Under this case, after bottoming in the wave c of (ii) I would be looking for the wave (iii) to push directly higher not needing that final wave (4) and (5). I am however still viewing this very much as an alternate path but it still is certainly on my radar and I will track it as a more immediate bullish resolution on the ES/SPX.
Finally, if we begin to break down below the 4540 level it would open the door to this still attempting to put in a top in the larger degree wave b which I am showing in red on the charts. The structure up off of the lows however is not very conducive to this red path but I am still going to leave it on the charts for the time being as this is the most straightforward alternate path that has the potential for this to still see new lows at the moment.