Markets In A Holding Pattern As We Near The Target Region For A Local Bottom
 By
By
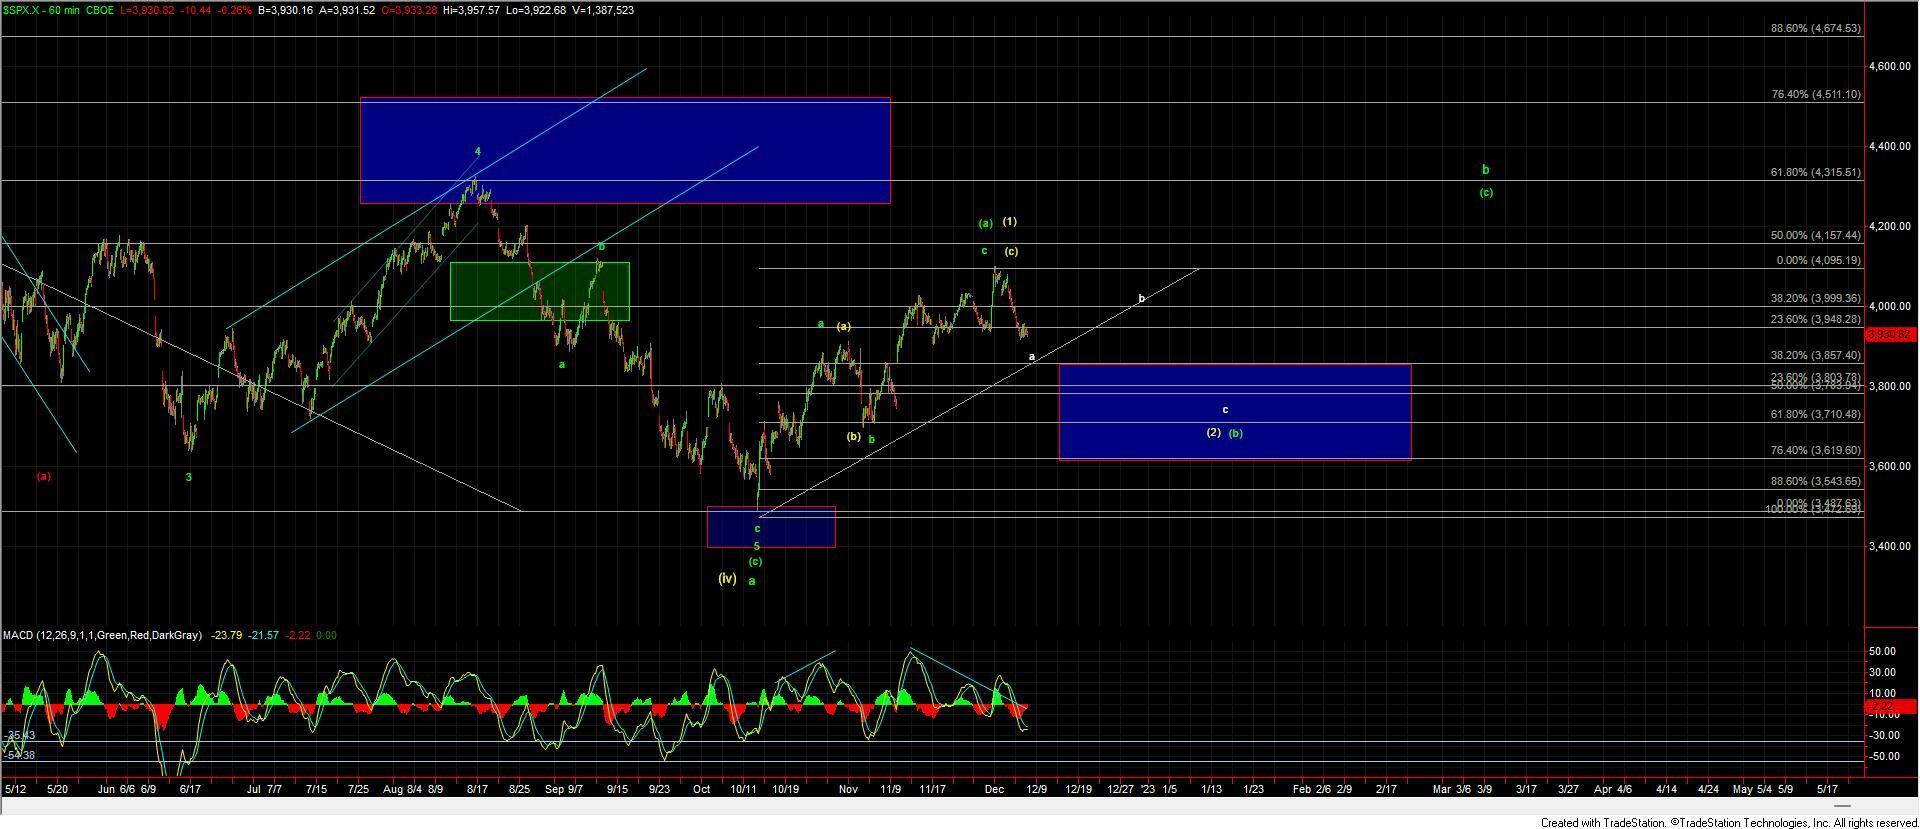
Today the markets moved sideways and for the most part, very little has changed from what has been laid out yesterday and this morning. As we have been noting the move down yesterday has given us the initial confirmation that we have indeed topped in the larger wave (1) shown in yellow or (a) shown in green. This is thus likely putting us in the midst of a larger corrective wave (2) or (b) that should still take us lower over the course of the next several weeks before finding a larger degree bottom.
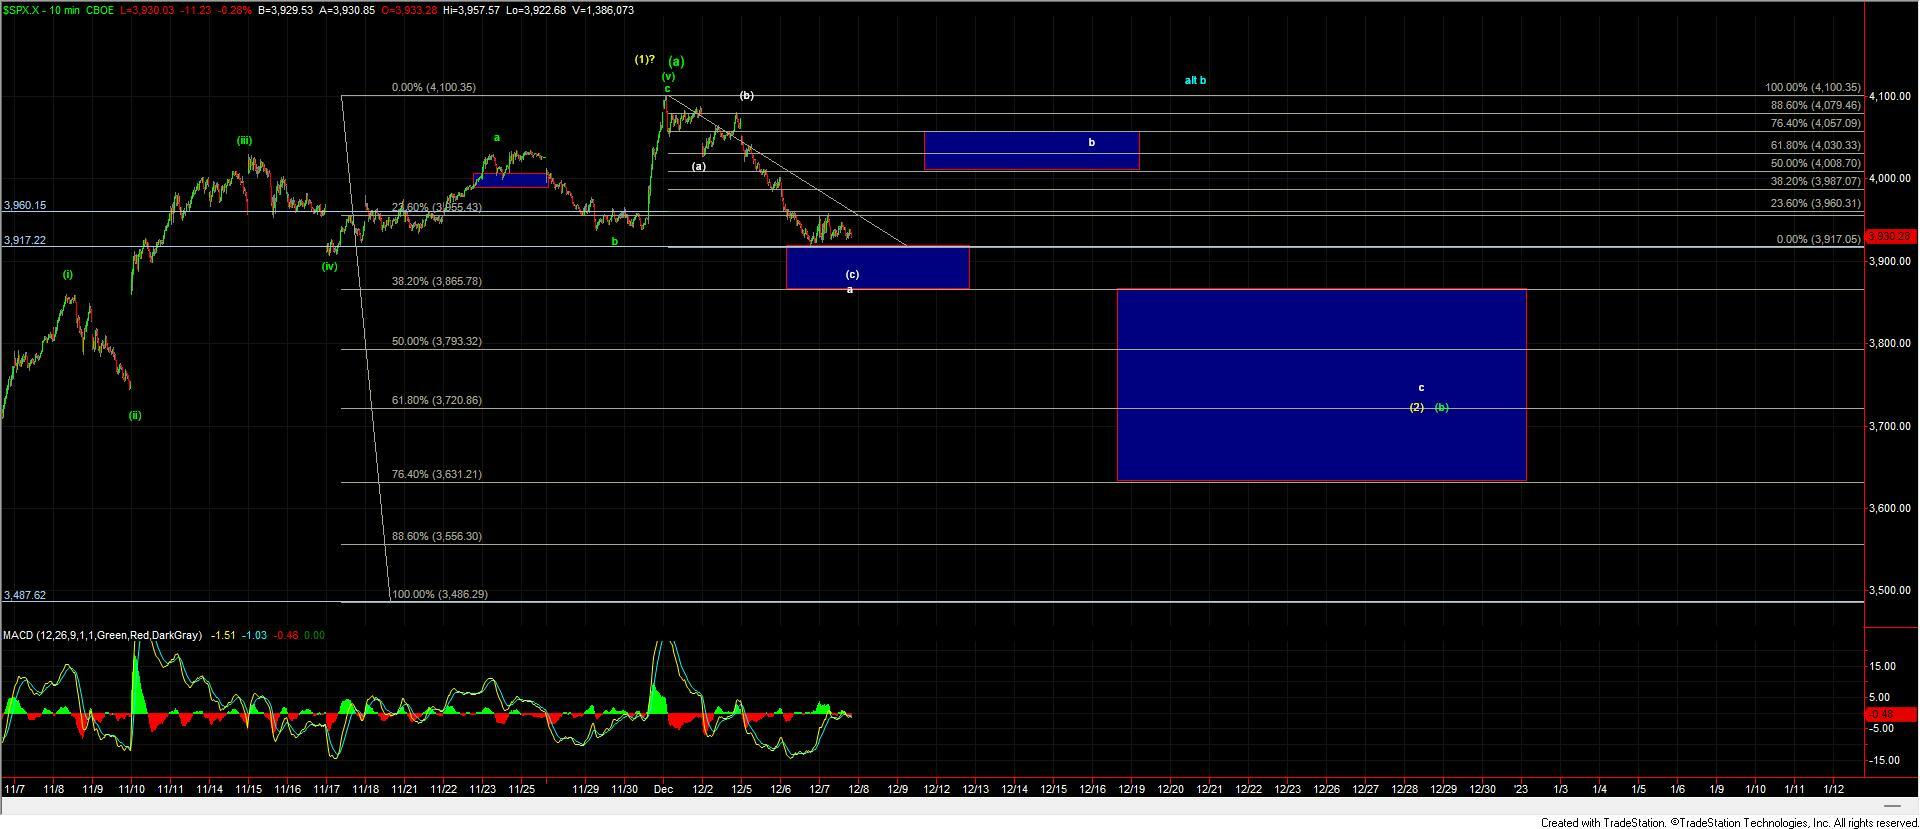
With the push into the 4100 level, the market gave us a full and complete count. This is allowing us to look for a standard ABC corrective move to the downside vs. a more irregular pattern. Unfortunately, the subdivisions of the move down off of the highs has some shallow retracements which is leaving the door open to a couple of different paths lower. So with that I am looking towards the larger degree fibs to help give additional guidance as to where exactly we may be within the corrective move down off of the highs.
As Avi noted yesterday it is quite common for the a wave of an initial move down to bottom at or near the 38.2 retrace of the larger move up. In this case, we are still a bit shy of that market with the 38.2 retrace sitting at the 3865 level. So with this coming up a bit short I still can't fully rule out that we may still see this move a bit further down toward that 3865 level before finding a bottom in the wave a. There is however some signals from a more technical perspective suggesting that we may indeed be quite close to finding that bottom.
We would need to see this push back up over the today's HOD on the SPX at the 3960 level followed by a break of the 3987 level to give us confirmation that a bottom is indeed in place for that wave a. Once that occurs then I would be looking for the wave b to take us into the 4030-4057 zone before turning lower once again for the larger wave c of (2)/(b). That wave b may take a bit of time and potentially take us towards the latter part of this month before seeing that wave c down into the early part of next year. Once that c wave completes it should then provide us with the setup to take the markets higher into the early part of next year. We do however still have some work to do before that setup is in place but as long as we do hold support it should provide us with our next buying opportunity.
So again with the sideways action in the markets today there is not too much new that I can add to the analysis, and I think the price over the next couple of weeks is likely to be choppy and not terribly reliable. So with that, it may be wise for most to remain patient while this corrective pattern resolves itself and to simply wait for the market to show its hand and provide us with a clean and clear setup that we are able to take advantage of into the new year.