Markets Held The Low But Still Not Out Of The Danger Zone
 By
By
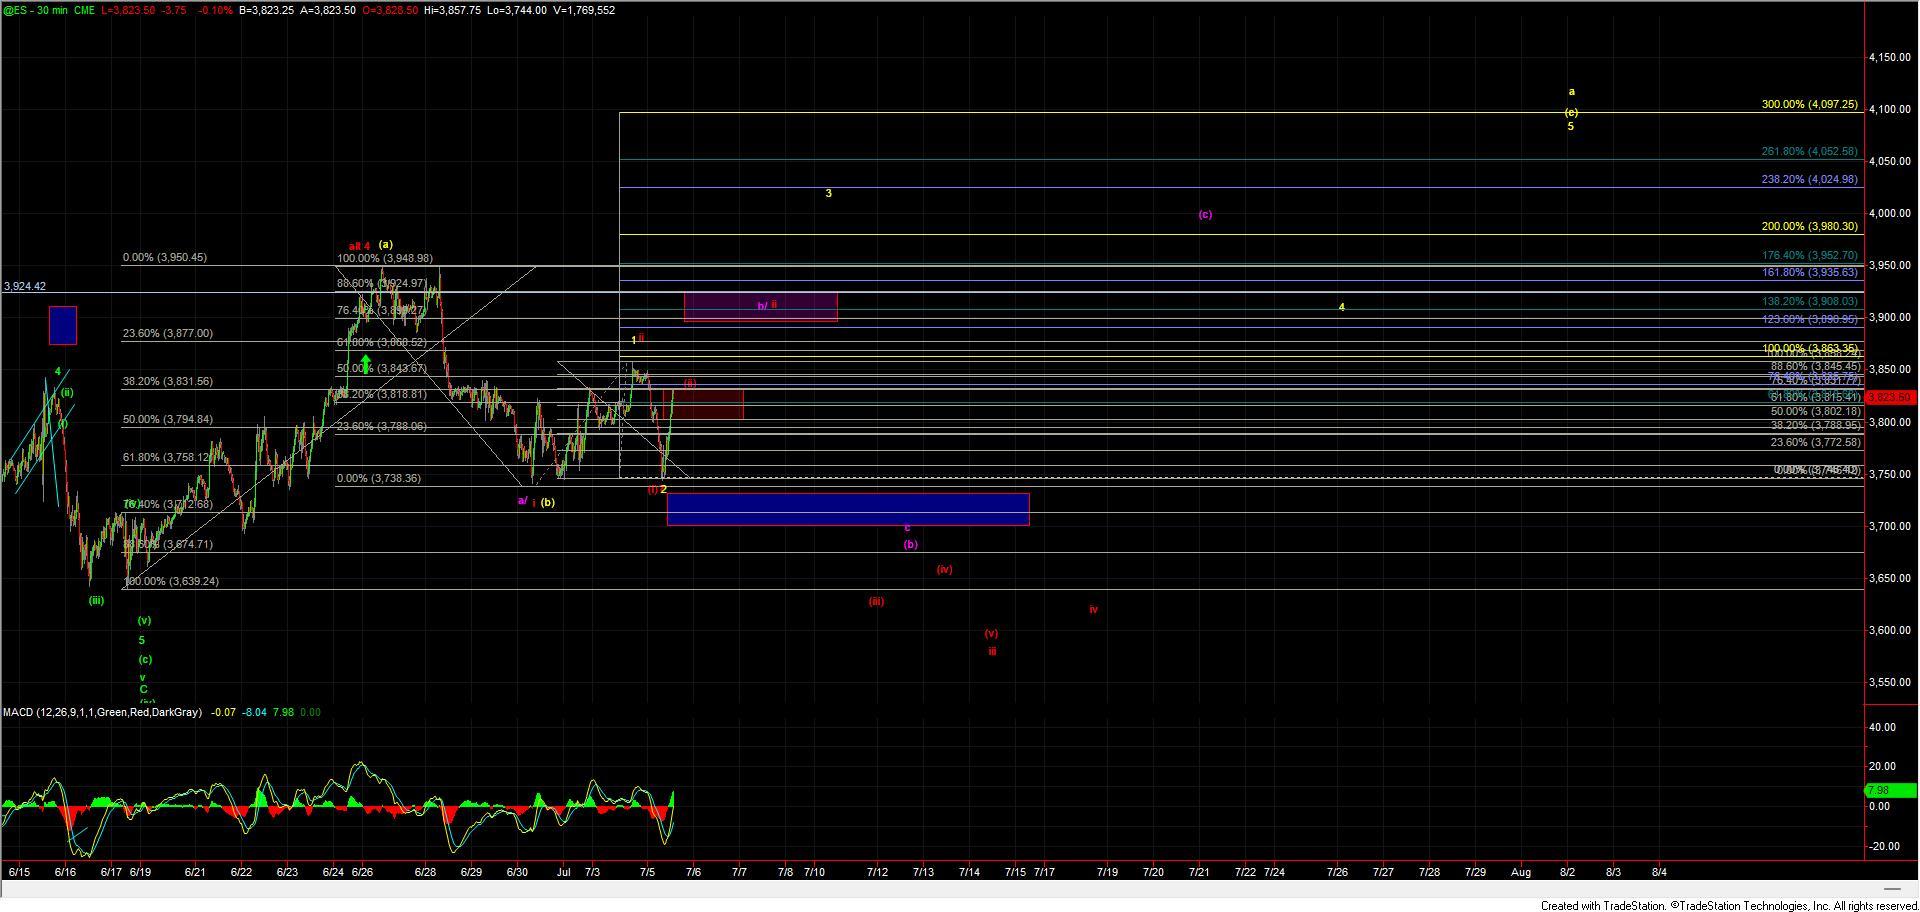
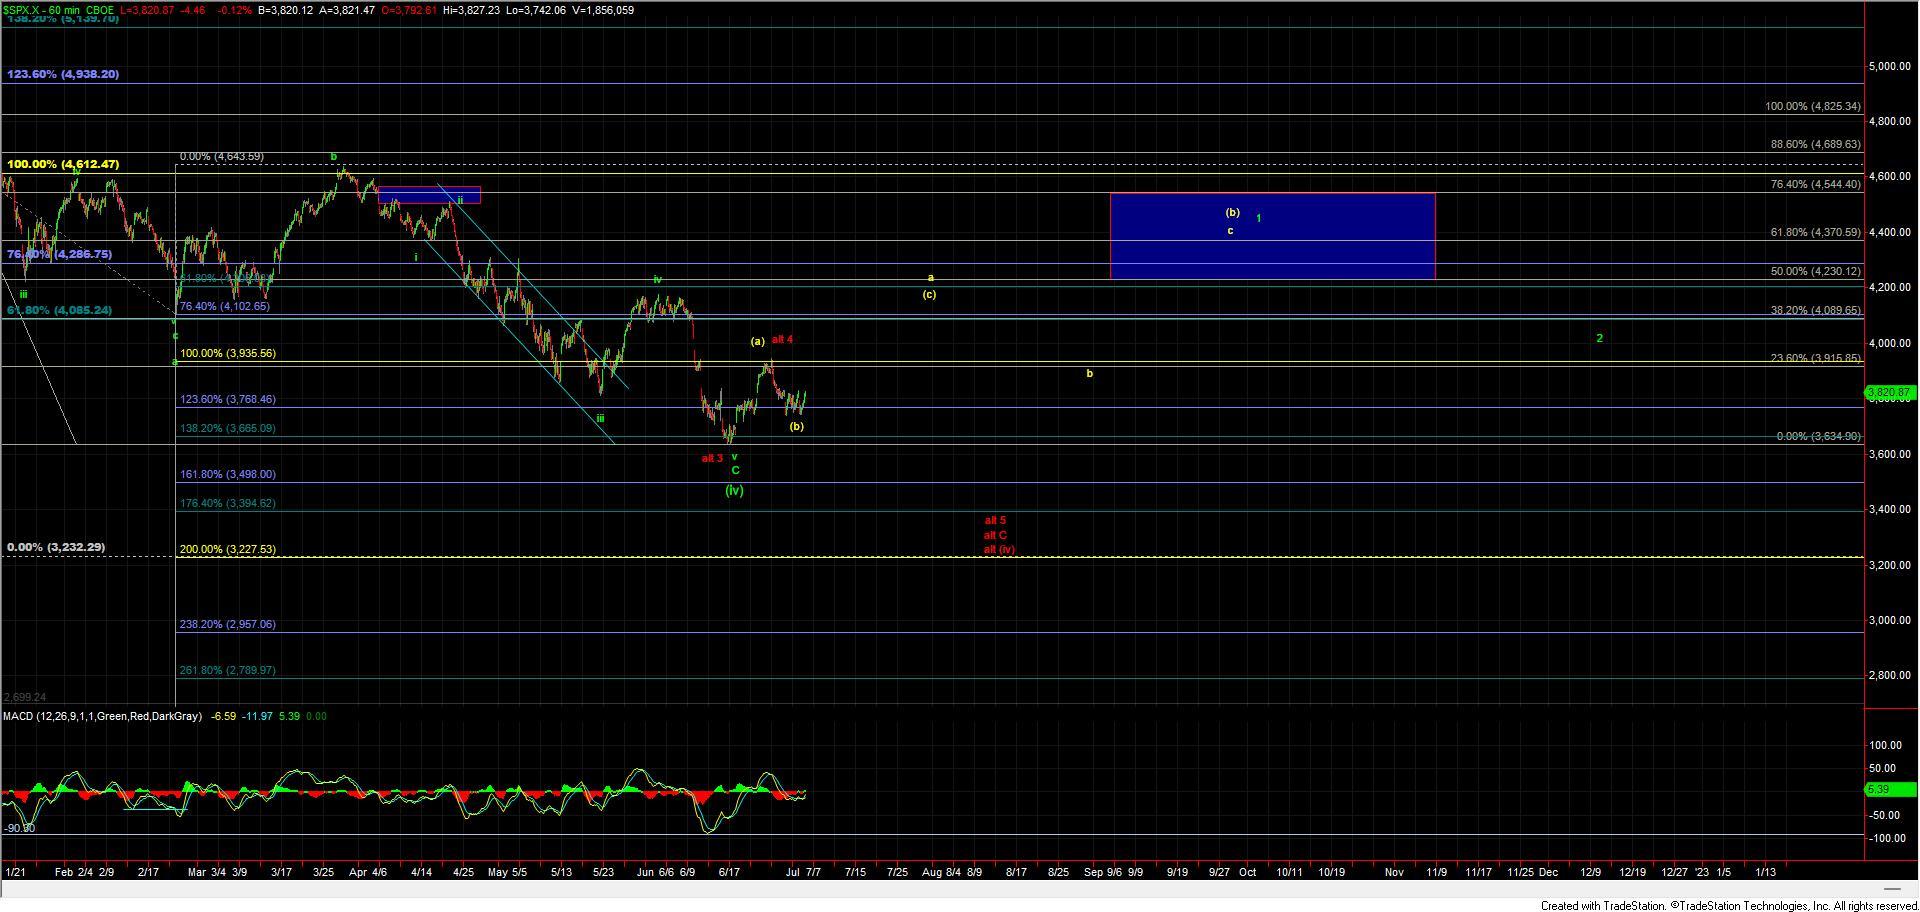
Today we started the day with several different paths that the market could have taken with the odds overnight of a break higher slightly edging out a direct break down lows. At the open however we tested the lower end of the lower end of the support zone for that shorter-term bullish path and then broke that support zone shortly thereafter. We did however not technically invalidate that immediate bullish count as we did hold the lows that were struck at 3738 thereby keeping that bullish count in play. We have since moved higher off of those lows however we are now sitting in the resistance/target zone for a potentially bearish path lower which would project to see the SPX move down towards the 3500-3450 zone. So with that, it looks like we are going to close at a fairy precarious spot and the market is going to need to continue to push higher through this region to give us a signal that we are not going to see a direct and sharp drop lower over the course of the next several days. I will lay out the various paths that we are watching below separately and discuss the levels that we need to see taken out to give us confirmation or invalidation of these paths thereby giving us a framework to watch over the next several days.
Yellow Count
The yellow count which is the most immediately bullish count would suggest that we are in the process of seeing a wave (c) up with today's LOD being a wave 2 of that wave c. This wave (c) would likey to be part of a larger corrective pattern or even part of a larger leading diagonal up off of the lows but in either case it should see a move beyond the 3948 high on the ES and ideally target closer to the 4024-4097 zone. Under this case we need to see this continue to push higher and move through the 3831 level and then follow that up with a move over the 3863 level. Moving through these levels would take out the most immediate bearish potential in the (i)-(ii) down shown under the red count. Now if we can manage to push through that 3863 level then the next key overhead resistance would come in at the 3899-3924 zone as holding this zone would still allow for another push lower as part of the purple wave c of (b). So while today's push higher has certainly given the yellow count a "stick save" it still has quite a bit to prove with the deep retrace that occurred this morning.
Red Count
As I noted above the red count is the most immediately bearish setup that is on the board and until we can clear the 3831 level and then the 3858 level it is still very much in play here with this current region being quite precarious as we are in the standard retrace zone for a wave (ii). Moving through that 3831 will however take a bit of pressure off of this path but we won't be out of the woods completely until we break over the 3858 level. IF we are able to push over that 3858 level then we will take out the most immediately bearish i-ii (i)-(ii) but we still could be developing either a larger i-ii or a-b down as shown on the charts. We would need to clear the 3899-3924 zone to take out this potential path and put us more clearly on track for the yellow count.
Purple Count
The purple count would be following a ver similar path to that of the larger i-ii down in red although instead of making a new lower low towards the 3500-3450 zone we would likey hold the 3712-3674 zone and bottom in a larger wave (b) before heading higher. This path would ideally top out around the 3863-3924 zone before moving lower in the wave c of (b). This path would start out very similarly to the larger red i-ii but again woudl not make a lower low ad turn higher before breaking the 3639 lows. This may be the most painful path for both bulls and bears so if we do indeed break over the 3858 level I will most certaiy be tracking this path qute closely but for now we still have a bit more work to do to clear the most immediately bearish red i-ii (i)-(ii) to the downside before I can even put this path in play.
So while this action is quite sloppy and there are still several alternate paths that we have to track knowing the parameters of each of these paths will help give us some guidance as to which path this is likely to take over the next several days. We also know where the danger zones lie and at which levels we need to be cautious with and if this market has proven anything over the past several months these dangers zone have been just that, quite dangourse. So until this market is able to finally break through these zones caution is still very much warranted as this market works its way through these price levels..