Markets Find A Local Top And Head For Support
 By
By
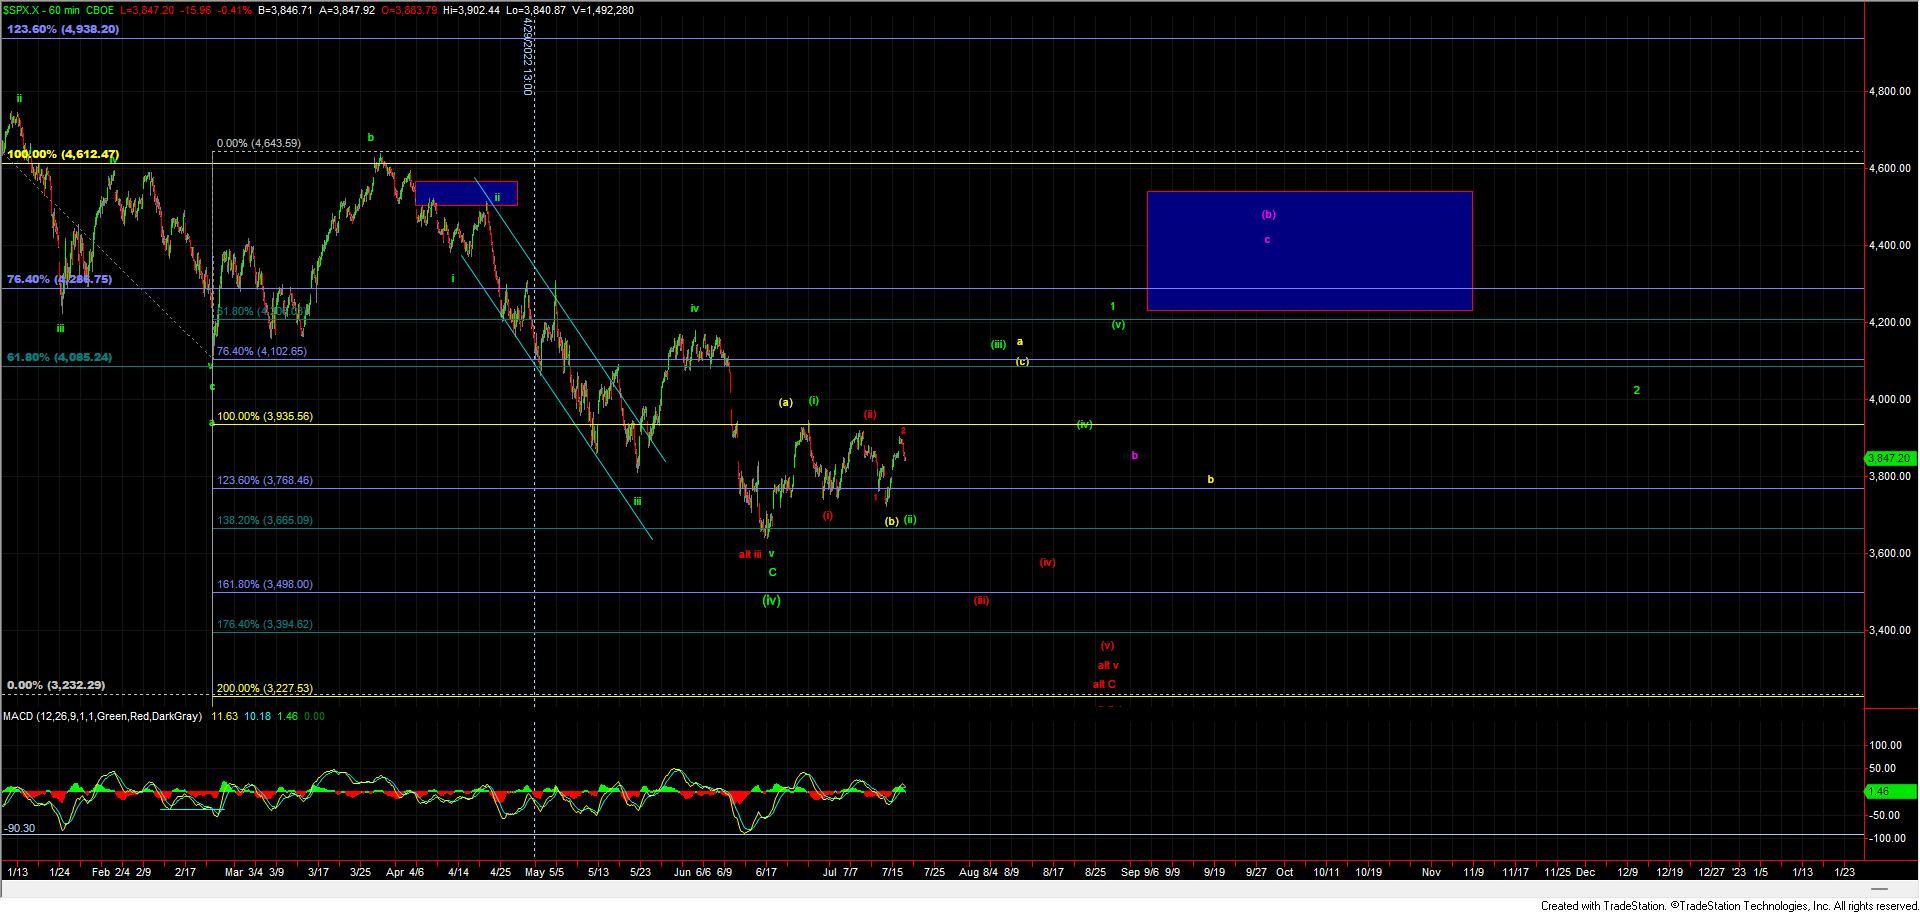
After moving sharply higher on Friday and continuing to push higher this morning we finally saw the market pullback and has broken under the upper support level that is giving us an initial signal that we may have put in at least a local top for the green wave a or yellow wave 1 (My previous purple count is now yellow to align with the charts that Avis is posting). So from here the parameters are fairly straightforward and as long as we can maintain over the standard support zone for the wave 2/b pullback under these paths we should see higher levels in the coming weeks ahead targeting over the 4000 region as Avi had laid out in his weekend update.
Yellow Count
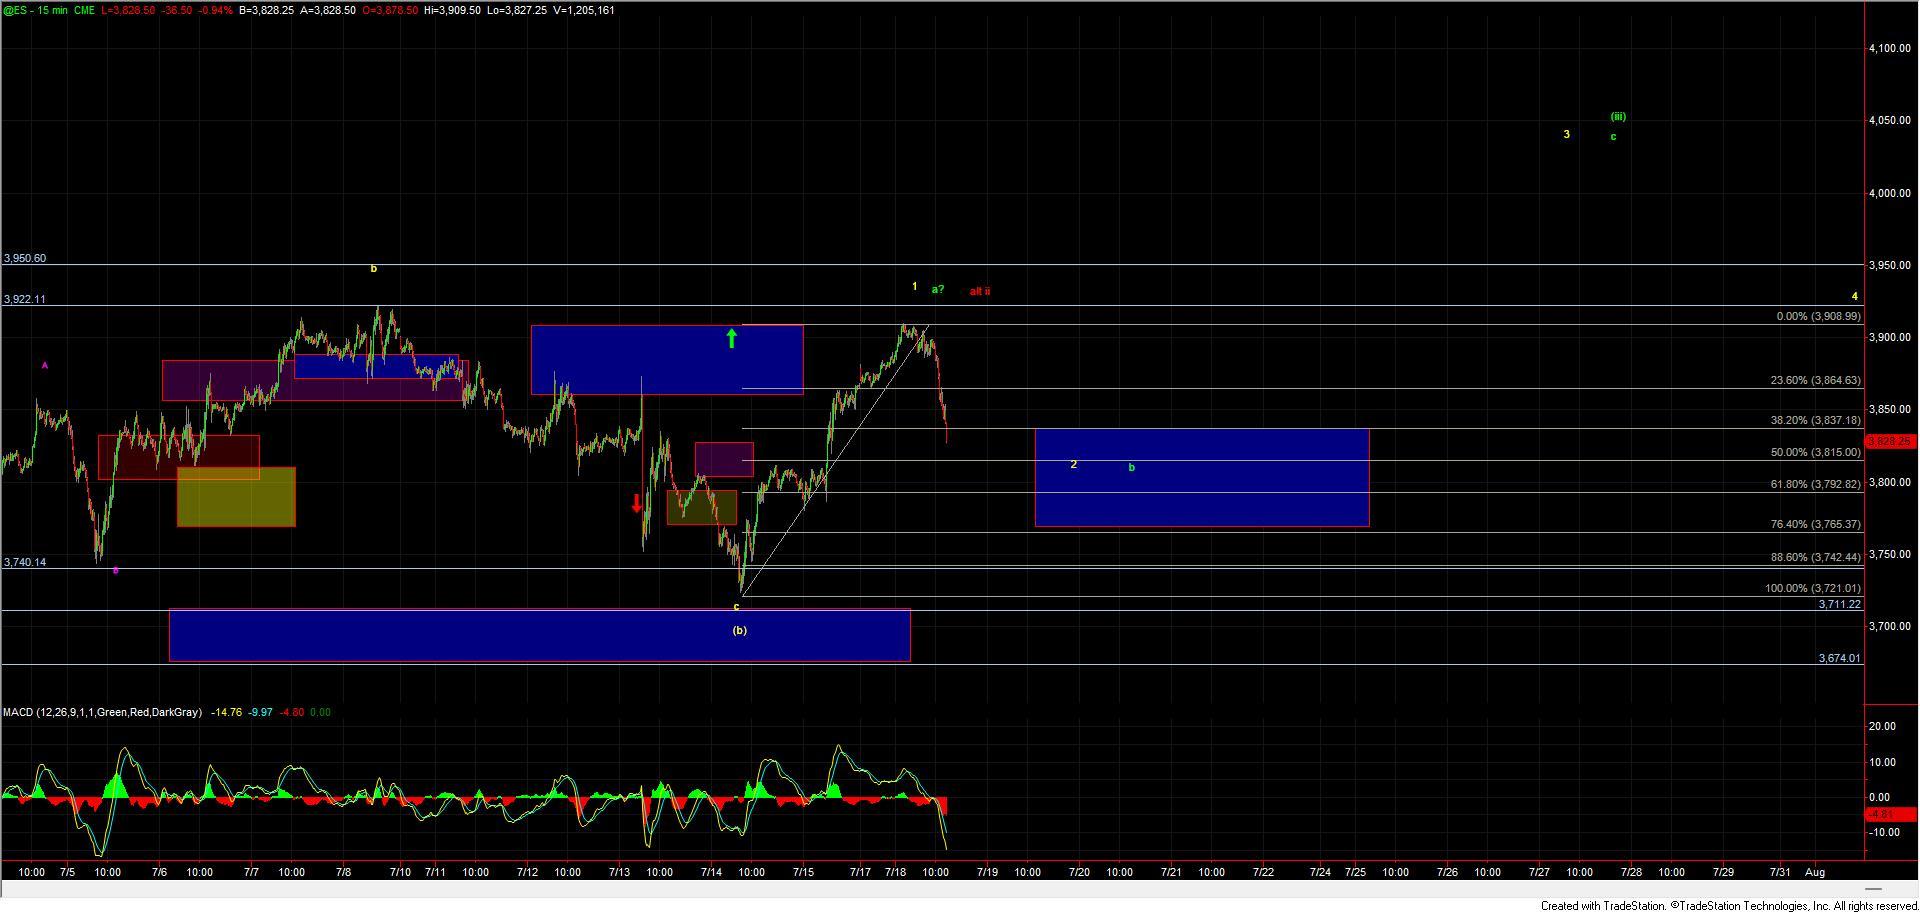
The yellow count would suggest that we are retracing in a wave 2 as part of a larger wave a within a larger ABC structure. This path should hold the 3837-3765 zone on the ESand that should then be followed by a five wave move to the upside off of one of the fibs within that zone to signal that a bottom has been struck in this yellow count. From there we should see a push back up over the 3922 high followed by a move towards the 4000 region. This should then be followed up with a wave 4 and 5 to finish up the larger wave a before retracing for a fairly deep wave b before heading higher once again.
Green Count
The Green count is very similar to the yellow count and will start the same up towards the 4000-4100 region. It will only be after we see a local top in this region that we will know the difference between the two paths. Under the green path should we see a move to that 4000-4100 region we should see a more shallow retrace for a wave (iv) that should be followed up with a wave (v) higher before seeing any significant top. If and when we do see that push up towards the 4100 area we can then layout the support for the potential wave (iv) which will help let us know if we are indeed following the yellow or green paths.
Red Count
The red path has become less probable with this price action but I still can't fully rule it out just yet. Until we get over 3922ES I do still have to leave the red count on the charts and allow for it to be developing a (i)-(ii) 1-2 down here. It would take a break of the 3765 level ES and then 3721 to trigger to the downside but again over 3922ES and then we can take this count off of the charts once and for all.
So while the pattern has been following the path as expected so far today we do need to keep a close eye on the price support levels that have been laid out as moving through these levels would open the door to seeing lower lows. Over those levels however and I am still leaning towards this pushing higher but with a pattern that is far from ideal I am still doing my best to be nimble in this market and not take anything for granted.