Markets Fill Out The Downside Pattern As We Move To New Lows
 By
By
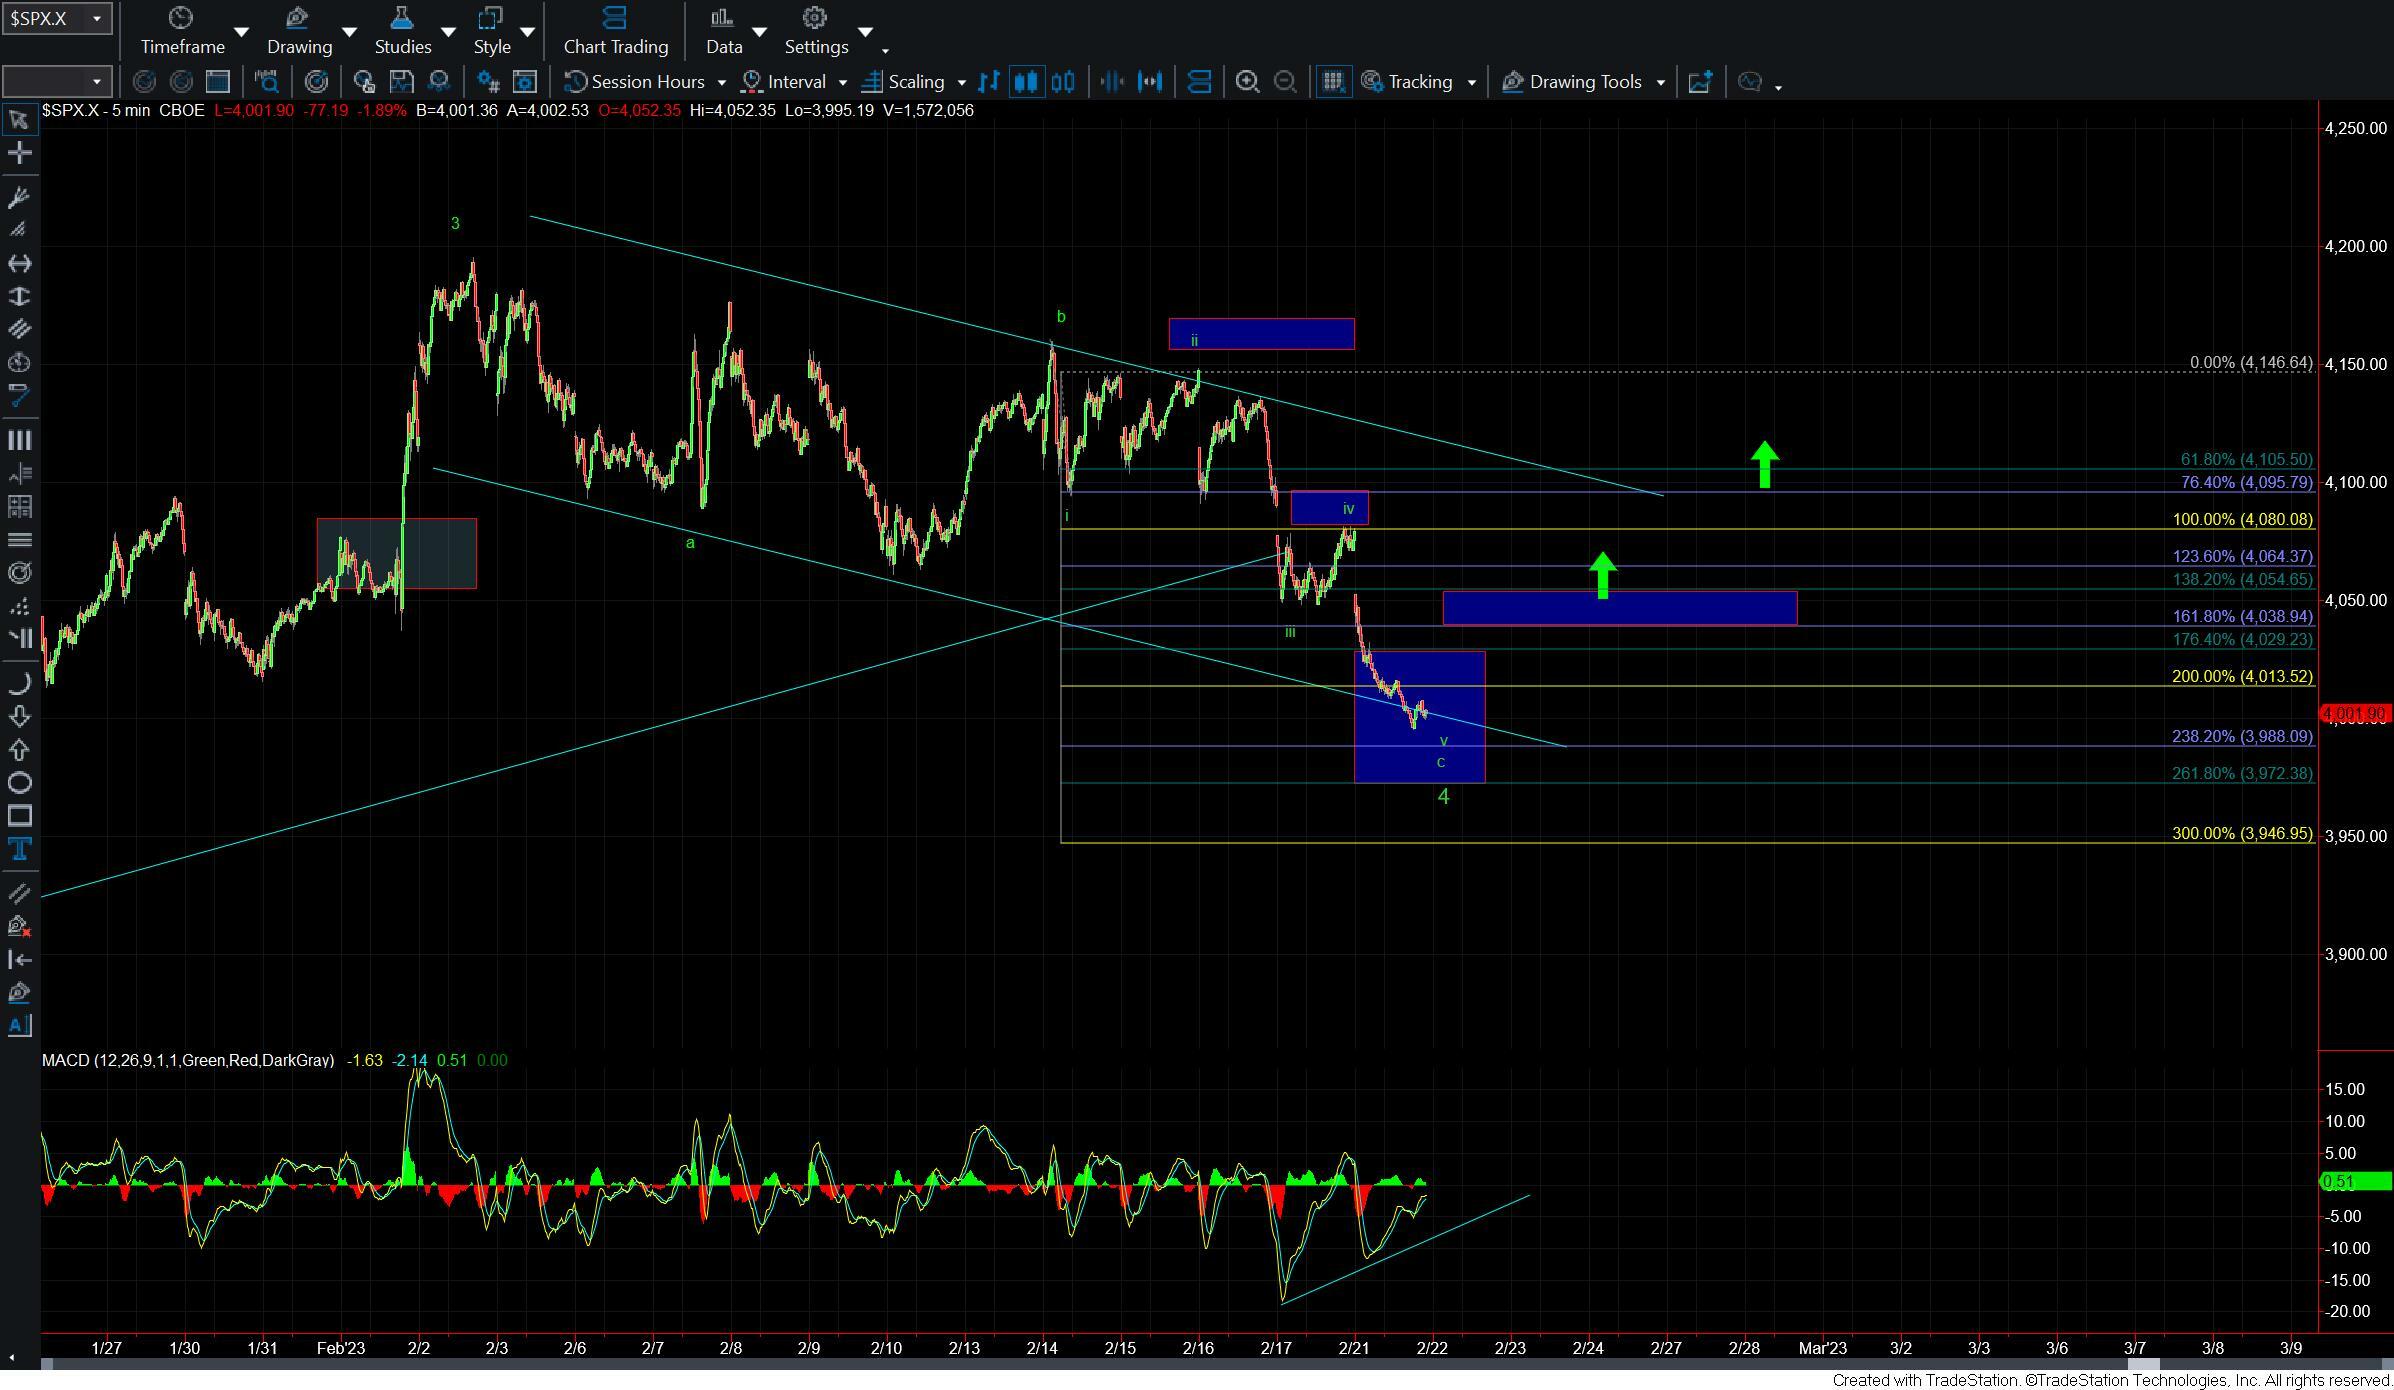
Overnight we held under the key resistance level that we had laid out last week for the potential wave iv of c of 4 and move down to new lows. This move to new lows has given us a potentially full pattern for the wave v of c of 4. Furthermore, we are now in the ideal target zone for this wave v of c of 4 which came in at the 4038-3972 zone. We are also forming a positive divergence on the 5-minute chart as we hit the middle part of that support zone.
We do however still have some work to do before we have the initial signal that we have put in a bottom. That initial signal of a bottom would come with a break back over the 4029-4054 zone overhead. From there I would want to see a break back over the 4080-4095 zone to give us further confirmation that a bottom is indeed in place. Keep in mind that because we are likely dealing with an ending diagonal we may not see a five-wave move up off of the lows to start the next leg up which is why the price levels are going to be key in helping to determine whether a local bottom is indeed in place.
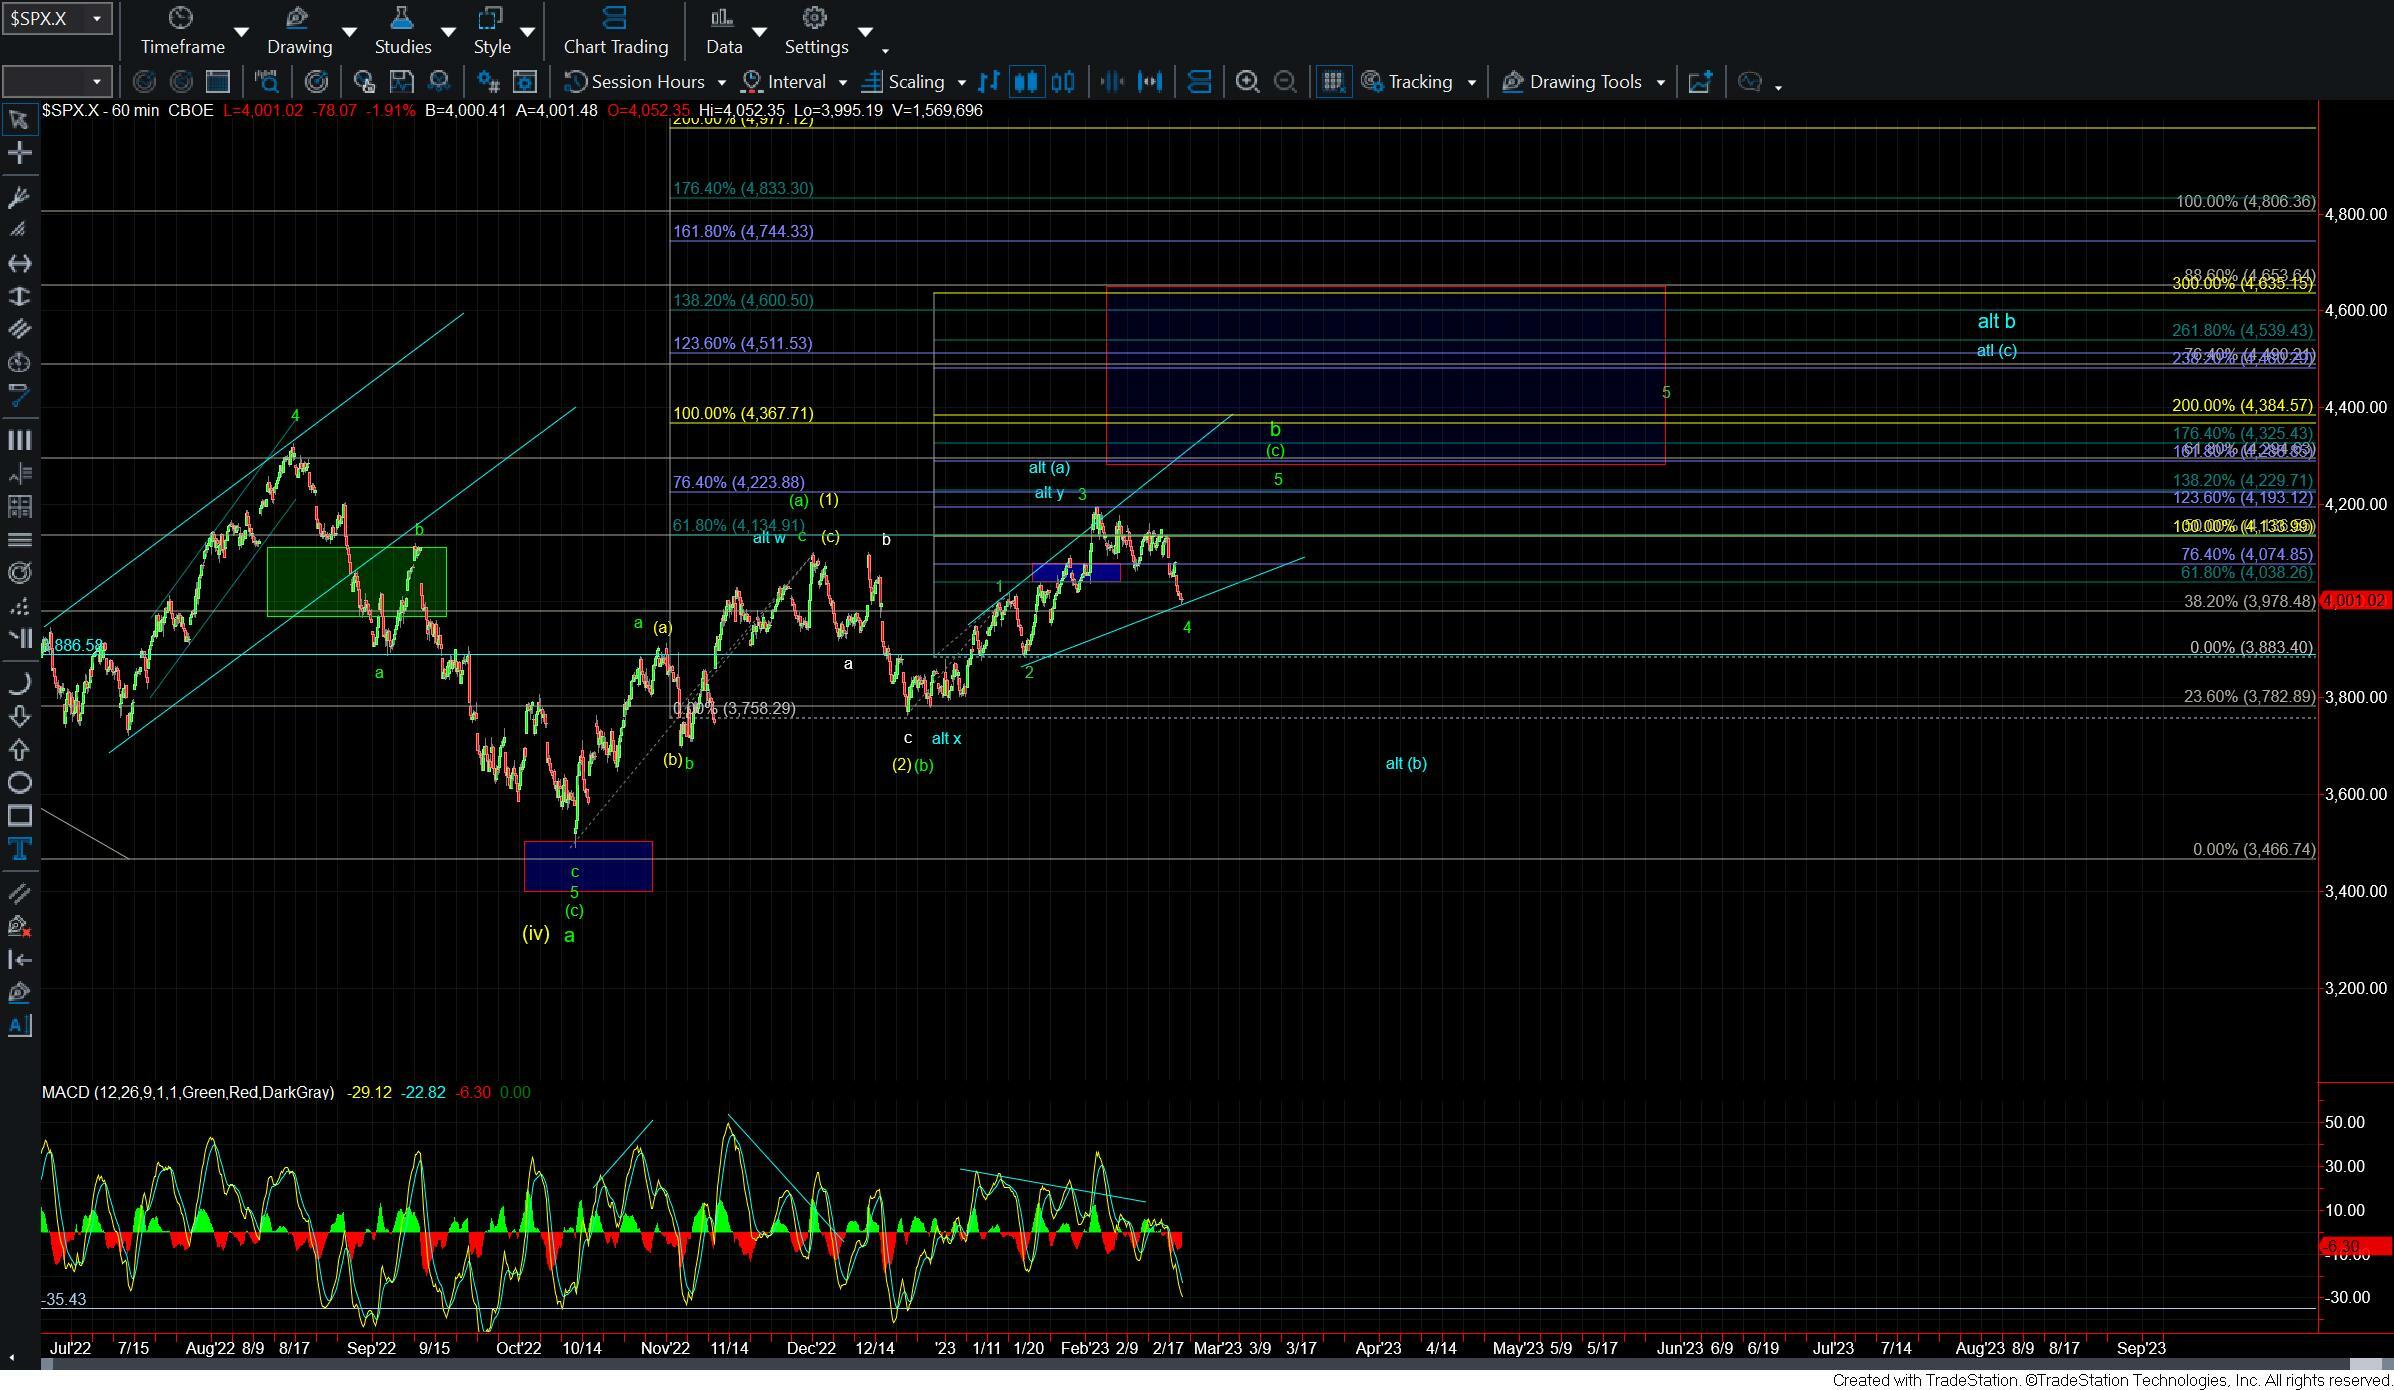
Zooming out to the bigger picture count as shown on the 60min chart we can see that the pattern to the upside still looks incomplete. This is the case even as a corrective move to the upside as the wave (c) of b still only has three waves. So with that, I have to still lean towards seeing another higher high to finish the wave 5 of (c) of b per the green count. I do however have to provide an alternate path that in the even that we are unable to hold support for the wave 4 and see a deeper move lower.
Under that alternate case as shown in blue we would have topped in a more complex corrective wxy pattern. Under that case, I would count the high at the 4203 level as the top of a wave (a) of the larger wave b. This would suggest that the current move down off of that high is part of a wave (b) within a larger wave b. If we are unable to hold the 3972 level and then see a further breakdown under the 3883 level then it would open the door to this blue count. As long as we hold that zone however the green count will remain my primary count and I will be looking for another higher high to finish off the abc pattern off of the October lows.
While this price action has been quite sloppy of late in the end I still have to give the benefit of the doubt to the more standard pattern which is laid out in green. Supportive of this green count is the positive divergence forming on the smaller degree timeframes as well as the oversold nature of the techs on the 60min timeframe. In the end, however, price is king, and should we continue to break down under support I have to be prepared with an alternate path even if it is far from an ideal pattern.