Markets Digest Their Gains As They Consolidate Over Support
 By
By
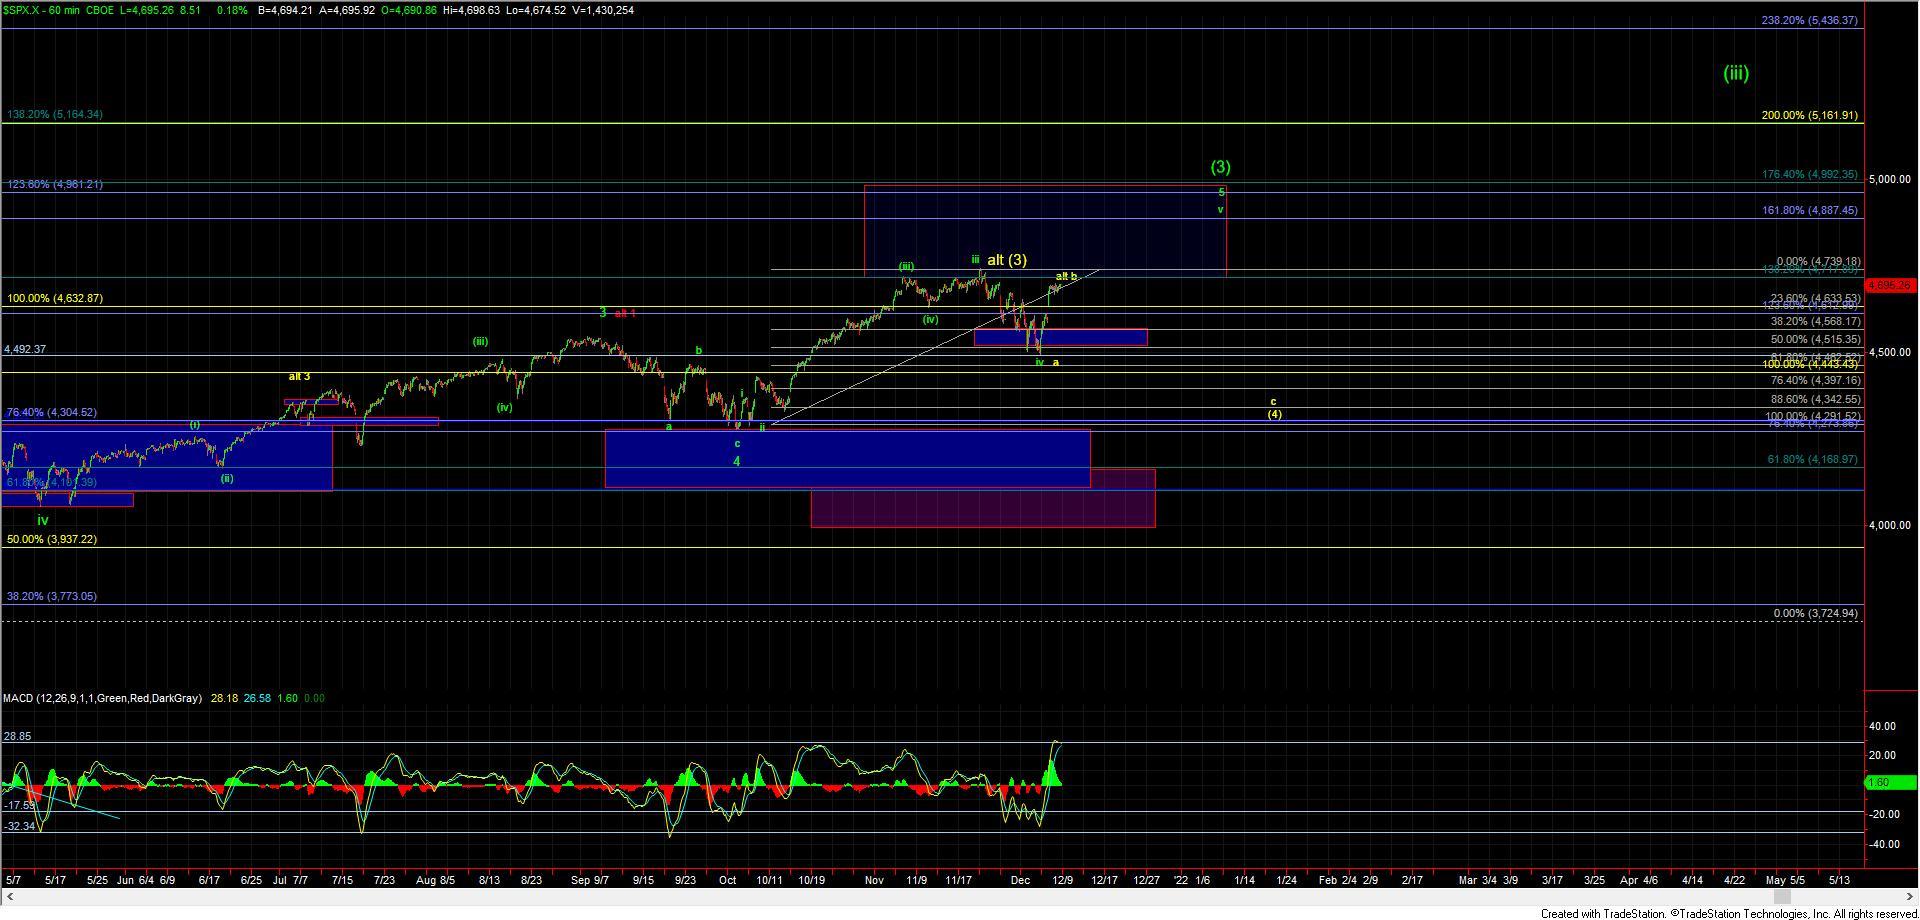
Yesterday we saw all of the equity markets move up sharply having reversed several weeks of losses in just one single trading session. We were counting the bulk of this move higher as being the heart of a wave (3) up off of the lows having topped out yesterday afternoon and then moving slightly higher overnight. Today the markets have simply been consolidating mostly sideways as the strong gains we saw yesterday are digesting. This action is not terribly surprising and is very much consistent with the base case that we are following the primary green count which is suggestive that we will see a wave (5) of larger wave (i) up off of the lows that were struck last week thus setting up further upside action over the coming weeks and into the new year.
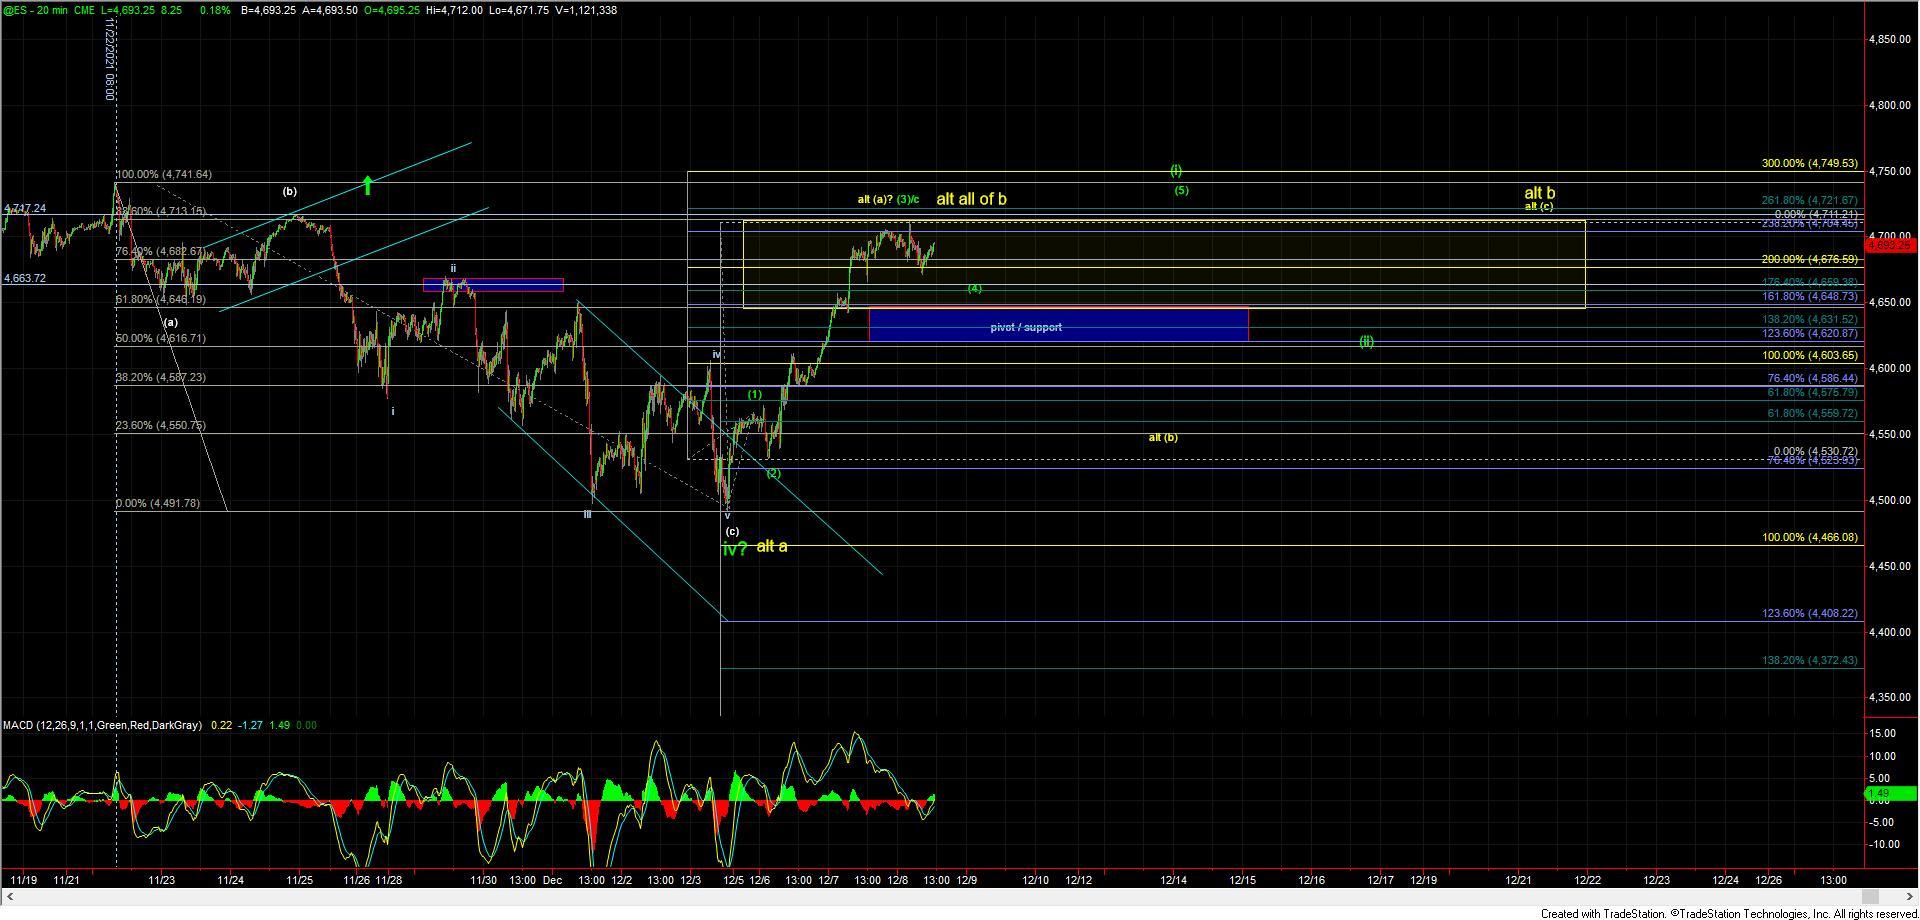
As I noted yesterday I am still counting the move up off of the lows as still only being three full waves so far with the top of the wave (3)/c likely having been hit overnight on the ES chart at the 4712 level. So while it is very much an alternate path at this point in time I do still have to allow for this to be attempting to form a top in a wave b. I am showing this potential b wave top as an alternate on the charts in yellow. The sharp action up off of the lows is much more typical of a third wave and consistent with the primary green count vs. that of a wave c of a b per the alternate yellow count.
Support for the green wave (4) in the 4648-4620 zone as shown on the ES charts. This wave (4) still may need to consolidate into tomorrow before finally breaking out back to new highs giving us that higher high for the wave (5) up off of the lows. This wave (5) would then mark the top of a wave (i) of one larger degree and give us further confirmation that we have indeed begun the wave v up off of the lows. After topping in the wave (i) we can then watch for a wave (ii) retracement which would potentially give us another shorter-term buying opportunity into the end of the year to finish off the wave v of (3) as shown on the SPX chart.
Alternatively, if this were to see a very clean five-wave move to the downside that breaks below the 4648-4620 support zone as noted above, then the yellow wave b would certainly be something to be on the lookout for. Unless and until that occurs, however, the pressure is going to remain up on in the equity markets in the near term and the odds are going to be in favor of seeing a Santa Rally into the end of the year.