Markets Continue To Move Lower But Still Have Bit Of Work To Confirm A Top
 By
By
After moving higher giving us a potentially full count across the indexes yesterday followed by a drop into the close today we saw a continued push lower thus giving us further evidence that we may have indeed put in a top for either the green or yellow counts. With that being said we do still have a bit more work to do to give us further confirmation that a top is indeed in place as so far the structure down off of the highs is only three waves and we have yet to break even the upper support levels for either of the topping counts. The structure on the RTY however is however quite sharp to the downside and still can very much develop into a full five down off of the highs which would help give an additional piece of evidence that we have indeed topped in the indexes. Of course, we do not need to see this initial move down start with five waves as the larger degree pattern should be corrective in nature but a five-wave start would help give us some additional parameters to work with whereas a three-wave start would have us relying more on the larger degree price levels from the move up off of the lows. Once we do top I expect a pullback towards at least the 3950 area under both the yellow and green counts with the yellow count potentially seeing a deeper drop than that. So as we have been noting although this top has been quite the process over the past several weeks there is still quite a bit more risk to the upside in this region.
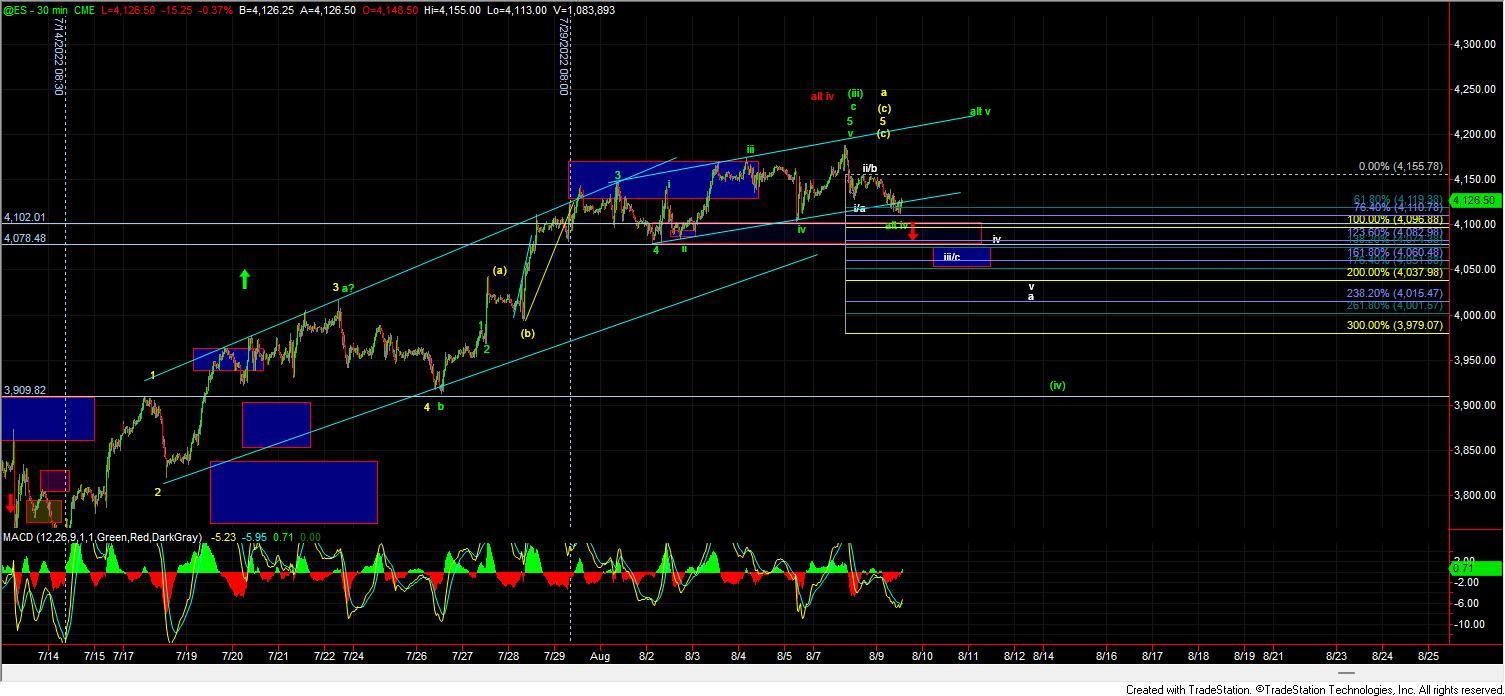
On the smaller degree timeframes (under both yellow and green) and with this move down off of the highs I can lay out the 4096 level as the next key pivot level for the ES to break to give us a signal that we have indeed topped. If we can see a break of that level while holding under the 4155 level then we would have a fairly clear path down towards the 4074-4060 region thus giving us further confirmation of a top as this would break the larger degree support zone that I have been watching at the 4077 level. If we are unable to move directly through 4096 but rather see this level hold then it would open the door to a number of possibilities. If that were to occur I would initially count that low as the bottom of the wave a down off of the highs as part of the start of a larger corrective move. It would however also open the door to still seeing another higher high as part a wave v which I am showing on the ES chart as an alternate.
Yellow Count
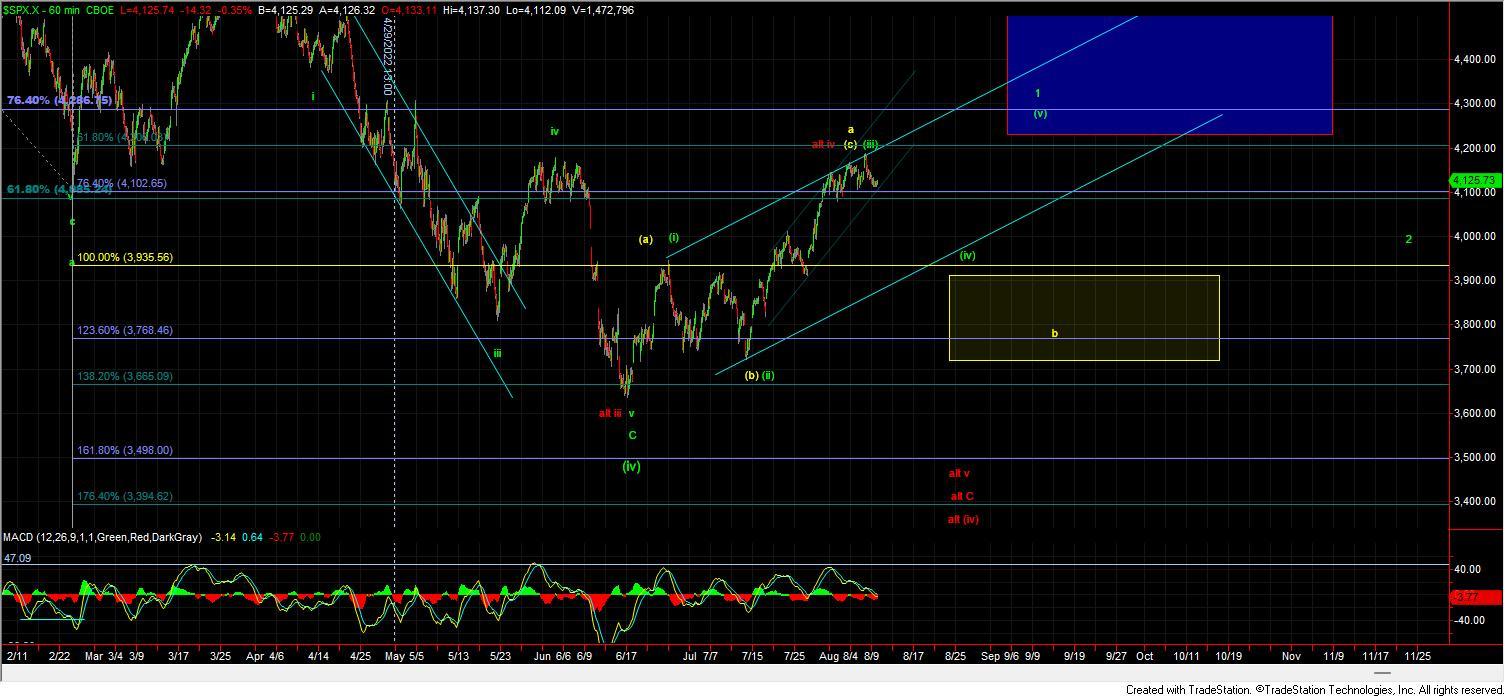
As noted previously week the yellow count would suggest that we are following an ABC up off of the June lows with the wave (c) of that ABC coming into completion near current levels in the form of an ending diagonal. As it is typical for the reversal out of an Ending Diagonal to be quite sharp back to the origination point if we are indeed following this yellow count I would expect to see a sharp move lower that ultimately targets the 3736 level below. I would want to see this move below the 3994 level followed by a break under the 3900 level to give us confirmation that we have indeed topped in this yellow count. Again this should be a fairly swift reversal to the downside under this yellow count so If we do break under the 3994 level but see a more muted move down then I think it would become more probable that we are following the green wave (iv) retrace.
Green Count
Under the green count, we still should see a pullback towards the 3950-3900 region and that pullback should take the form of a three-wave move. We should however see another higher high back over the current high to complete a potential leading diagonal up off of the lows. The initial move down off of the highs will likely be very similar to that of the yellow count but again the drop will not be nearly as sharp or deep before turning higher once again. Additionally, once this does bottom in the wave (iv) the final leg up for the wave (v) of 1 is likely going to give us more sloppy action as it should take the form of another three-wave move to fill out the last leg of the leading diagonal.
This toping region has most certainly been a process over the past several weeks and while this grind-up may have seemed a bit relentless today we are trading in about the same region as we were since July 29th. This slow grind can try one's patience but because the pattern is so overlapping which is suggestive that we are dealing with at least one ending diagonal I still am viewing this region with still a fair amount of risk to the immediate upside. With that, the pullback down towards at least the 3950-3900 remains the base case with still the potential to see a deeper pullback per that yellow count. So for those reasons, I still remain cautious here to the long side and will wait to see how deep the next pullback goes and what the structure looks like into those lows to assess the next opportunity to the long side.