Markets Continue To Melt-Up As The SPX Pushes To New All-Time Highs
 By
By
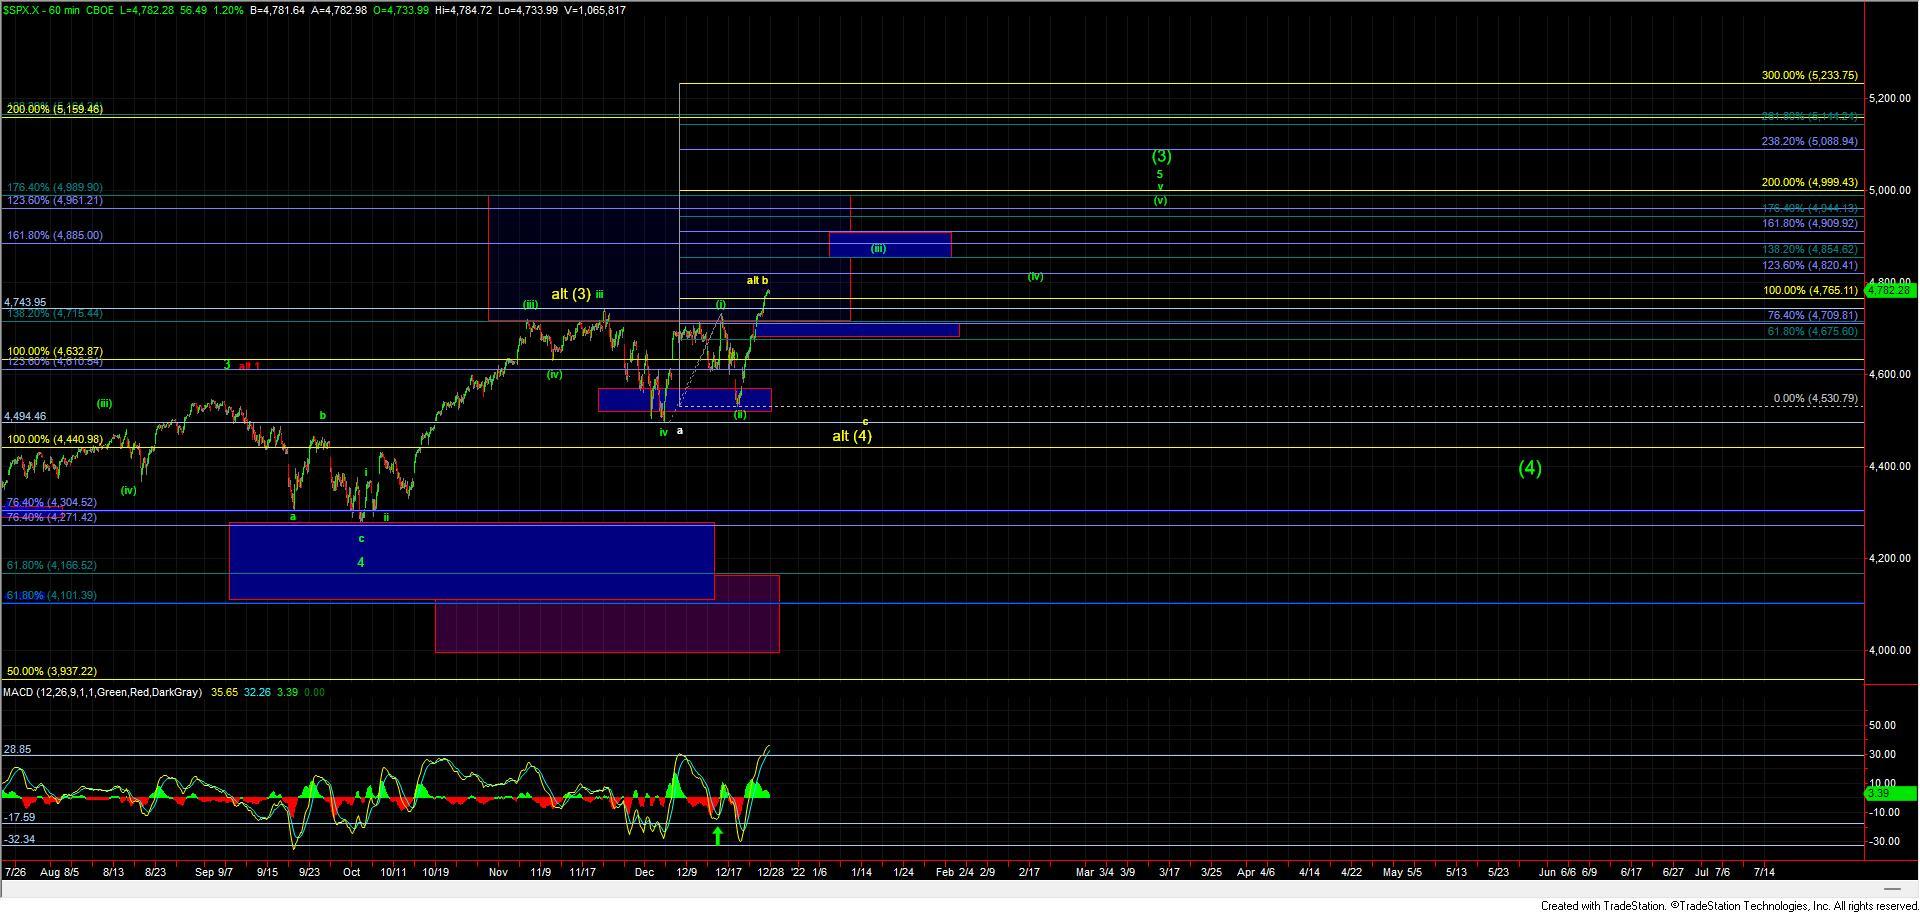
Today the market continued last week's theme of "melt-up" as the SPX once again pushed strongly higher breaking through the next cluster of fibs and previous all-time highs which sat at the 4743 level on the SPX. This push to new highs and through the key fibs is giving us further confirmation that we are indeed following the primary green path which we have been tracking for the past several weeks. This green path is suggestive that we put in a bottom in the wave (ii) of v of 5 of the larger degree wave (3) on December 20th. This then likely puts us in the wave (iii) of that move which explains the strong and sustained push that we have seen since the low that was struck on December 20th. Having pushed through several areas of smaller degree fib clusters we are now approaching a fairly key spot which I would expect the market to find some resistance on the smaller degree timeframes which can be seen on the ES chart. We do however have fairly clear parameters on the board at the moment as we are following a very clean fib pinball path up off of the December 3rd and the 20th lows so far.
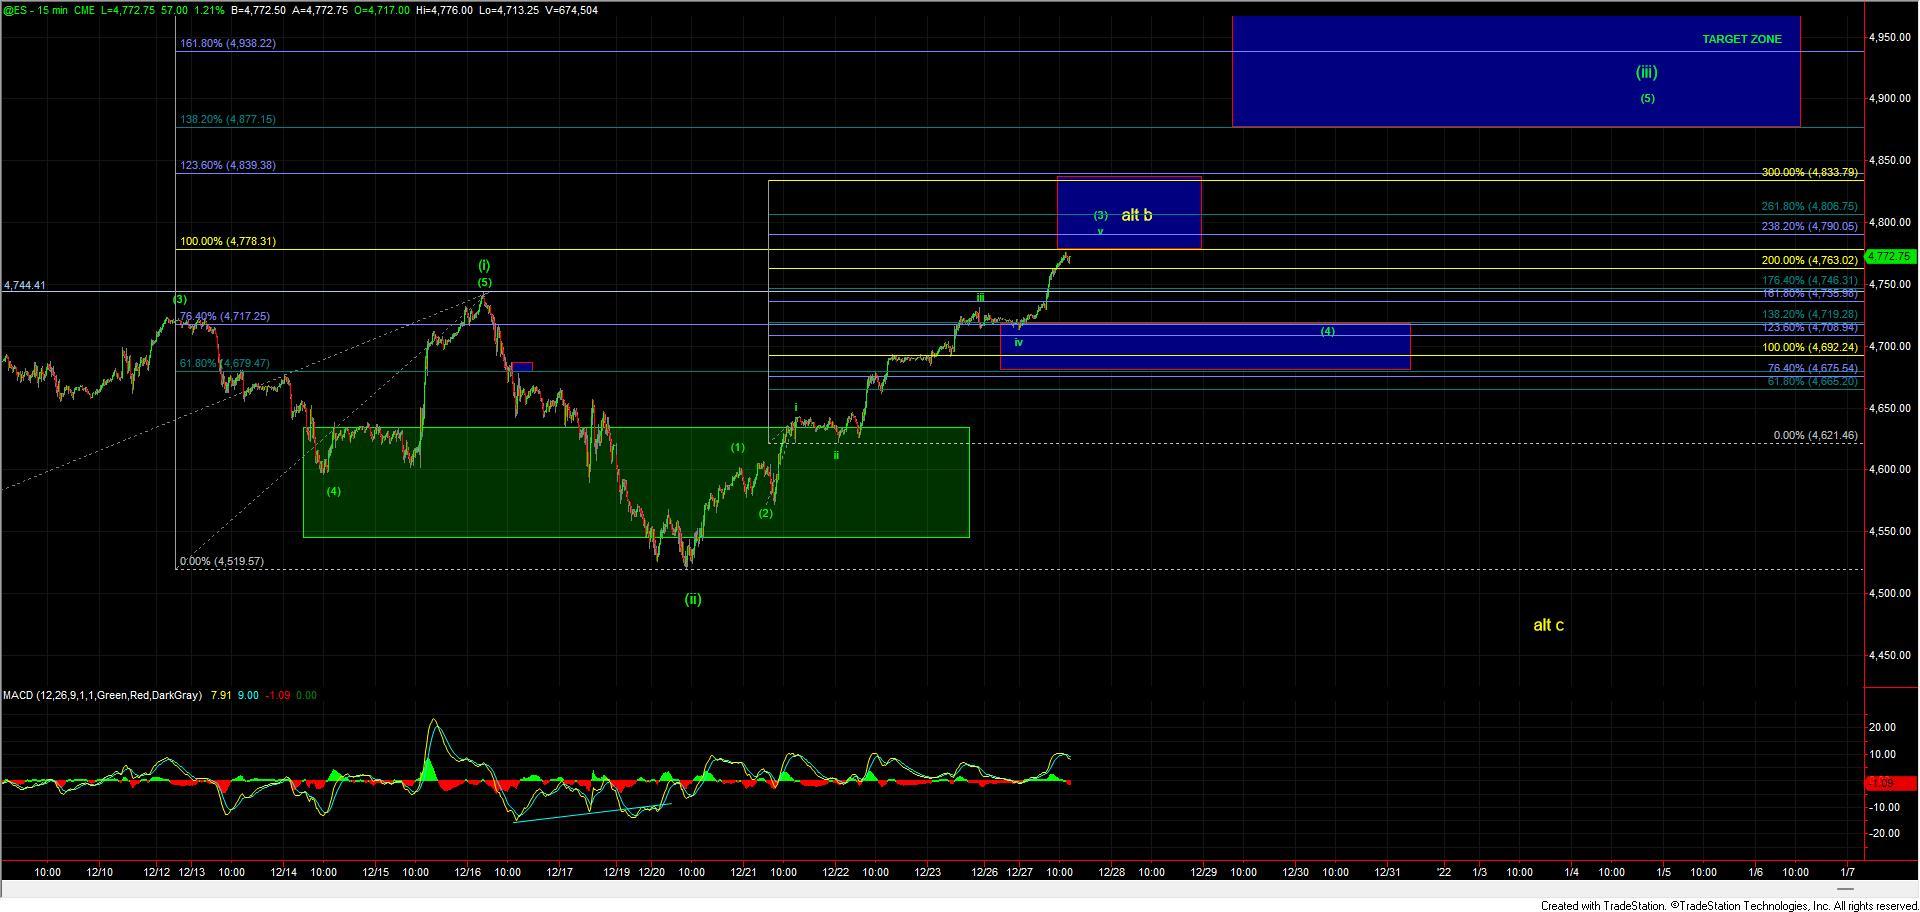
Zooming into the ES chart we can see that today we touched the 100ext of the initial move up off of the December 3rd low. This level has a fairly good confluence of the 200ext from the move up off of the December 21st low which and a full five up off of that level. We can count this as the topping zone for the wave (3) of (iii) with the standard target coming in at the 100ext - 123.6 ext of the larger wave (i) off of the Dec 3rd low. So if we manage to hold that 4778 level then we can expect to see a consolidation/retrace in this region for the wave (4) of the larger wave (iii). This retrace should hold over the previous pivot for the wave (i) which came in at the 4717-4679 zone. If we see a direct break of that 4778 level from her then it would open the door for this to see an extended wave (3) which has the potential to extend up towards that 123.6 extension at the 4839 level on the ES before seeing the retrace for the wave (4) of (iii). In either case however, as long as we can hold over the 4717-4679 zone the near term pressure will remain up as laid out on the green count and a move into the 4900-5000 region is still likely to be seen before this tops out in the larger degree wave (3).
As far as the alternate path is concerned, we still can't fully rule out that this may be topping in the yellow wave b still needing that larger wave c of (4) down. The push beyond the previous all-time highs today has however made this path less probable but we still can't fully rule it out at this point in time. For this yellow path to trigger, we would need to see a full five down off of the highs AND a break of the support zone laid out above. Unless and until we see that occur then green more immediately bullish path remains very much the primary path.
In summary, this has followed our fib pinball guidelines very well and there is nothing to suggest that we are following anything other than the green primary bullish path on our way towards that 4900-5000 zone. Only if we see a break of support on five waves would the continued push to higher levels to complete the larger wave v up off of the December 3rd lows become at risk of filling out.