Markets Closing In On Key Smaller Degree Support
 By
By
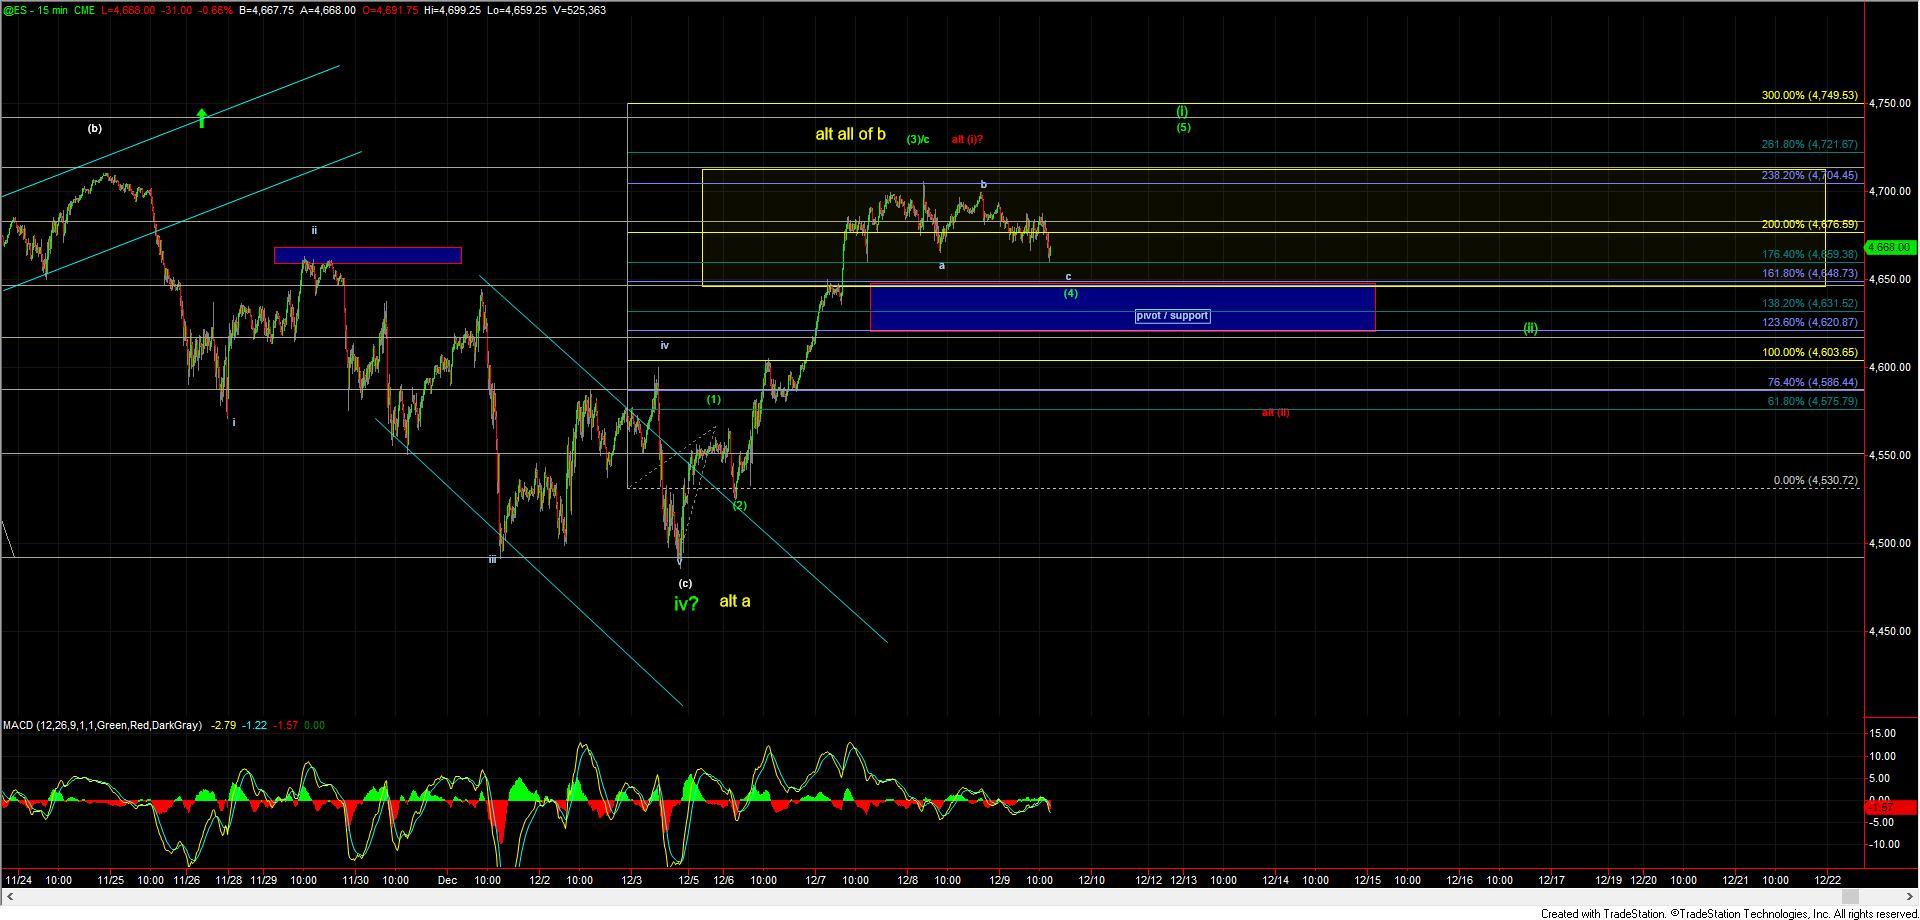
After seeing a relatively flat consolidation yesterday the markets saw a bit of a deeper drop towards the support zone laid out on the smaller degree ES charts. As I noted yesterday this support zone represents the ideal level top hold to keep the green count in play on these smaller timeframes. Again this green count is suggestive that we will see a wave (5) of larger wave (i) up off of the lows that were struck last week thus setting up further upside action over the coming weeks and into the new year.
I do still think that the move up off of the lows counts best as still only being three full waves so far with the top of the wave (3)/c having been hit on the ES chart at the 4712 level. So with that and while it is an alternate path at this point in time I do still have to allow for this to be attempting to form a top in a wave b. I am showing this potential b wave top as an alternate on the charts in yellow. The sharp action up off of the lows is much more typical of a third wave and consistent with the primary green count vs. that of a wave c of a b per the alternate yellow count.
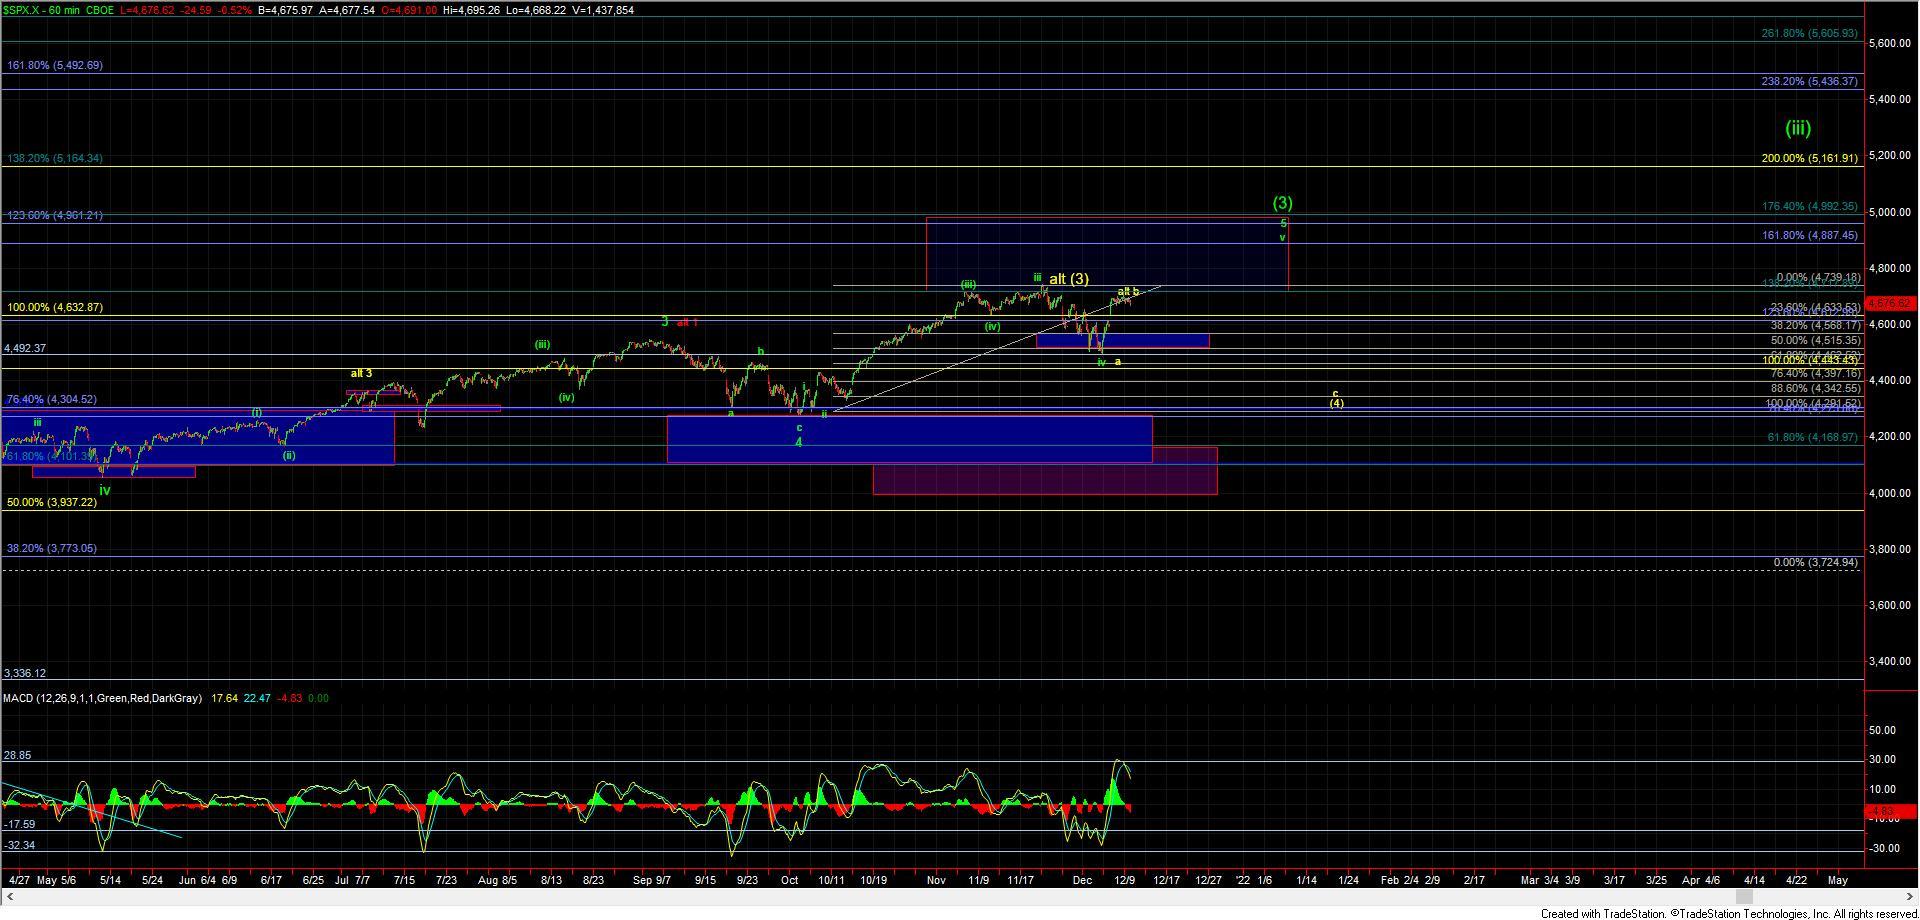
Support for the green wave (4) in the 4648-4620 zone as shown on the ES charts. This wave (4) still may need to consolidate into tomorrow before finally breaking out back to new highs giving us that higher high for the wave (5) up off of the lows. This wave (5) would then mark the top of a wave (i) of one larger degree and give us further confirmation that we have indeed begun the wave v up off of the lows. After topping in the wave (i) we can then watch for a wave (ii) retracement which would potentially give us another shorter-term buying opportunity into the end of the year to finish off the wave v of (3) as shown on the SPX chart.
So far this retrace down on the ES is still very constant with what we would expect with a wave (4) retrace so I really do not have any concerns on the ES chart itself. Furthermore, the VXX is also tracing out a very clean fourth wave of the same degree. The RTY chart is a bit more problematic as it is near the lower end of support for that same potential fourth wave so ideally, I would prefer to see the RTY hold today's LOD to keep the cleanest path forward on all of the various equity charts that I track. With that being said I am going to keep my primary focus on the ES chart at this point in time and as long as we can hold over the 4648-4620 support zone as noted I will continue to count this retrace as a micro wave (4) still looking for one more push higher to fill out the wave (5) of (i) as noted per the green count.