Markets At An Inflection Point As We Move Into Key Resistance
 By
By
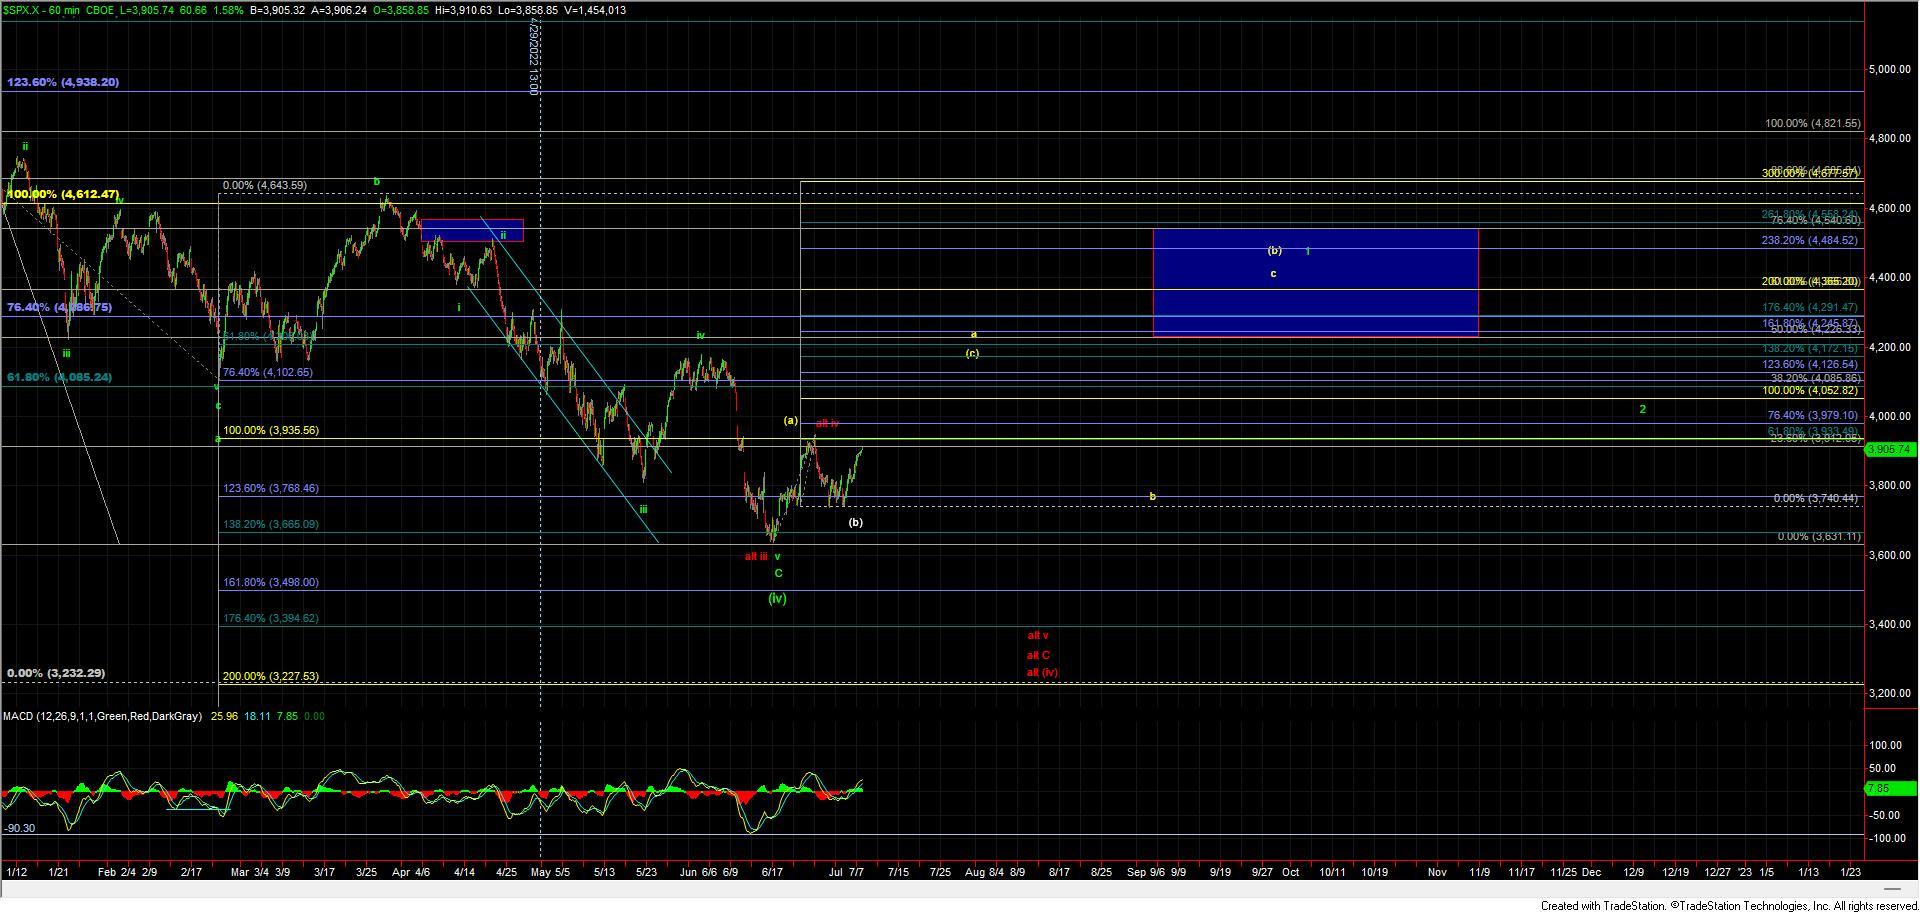
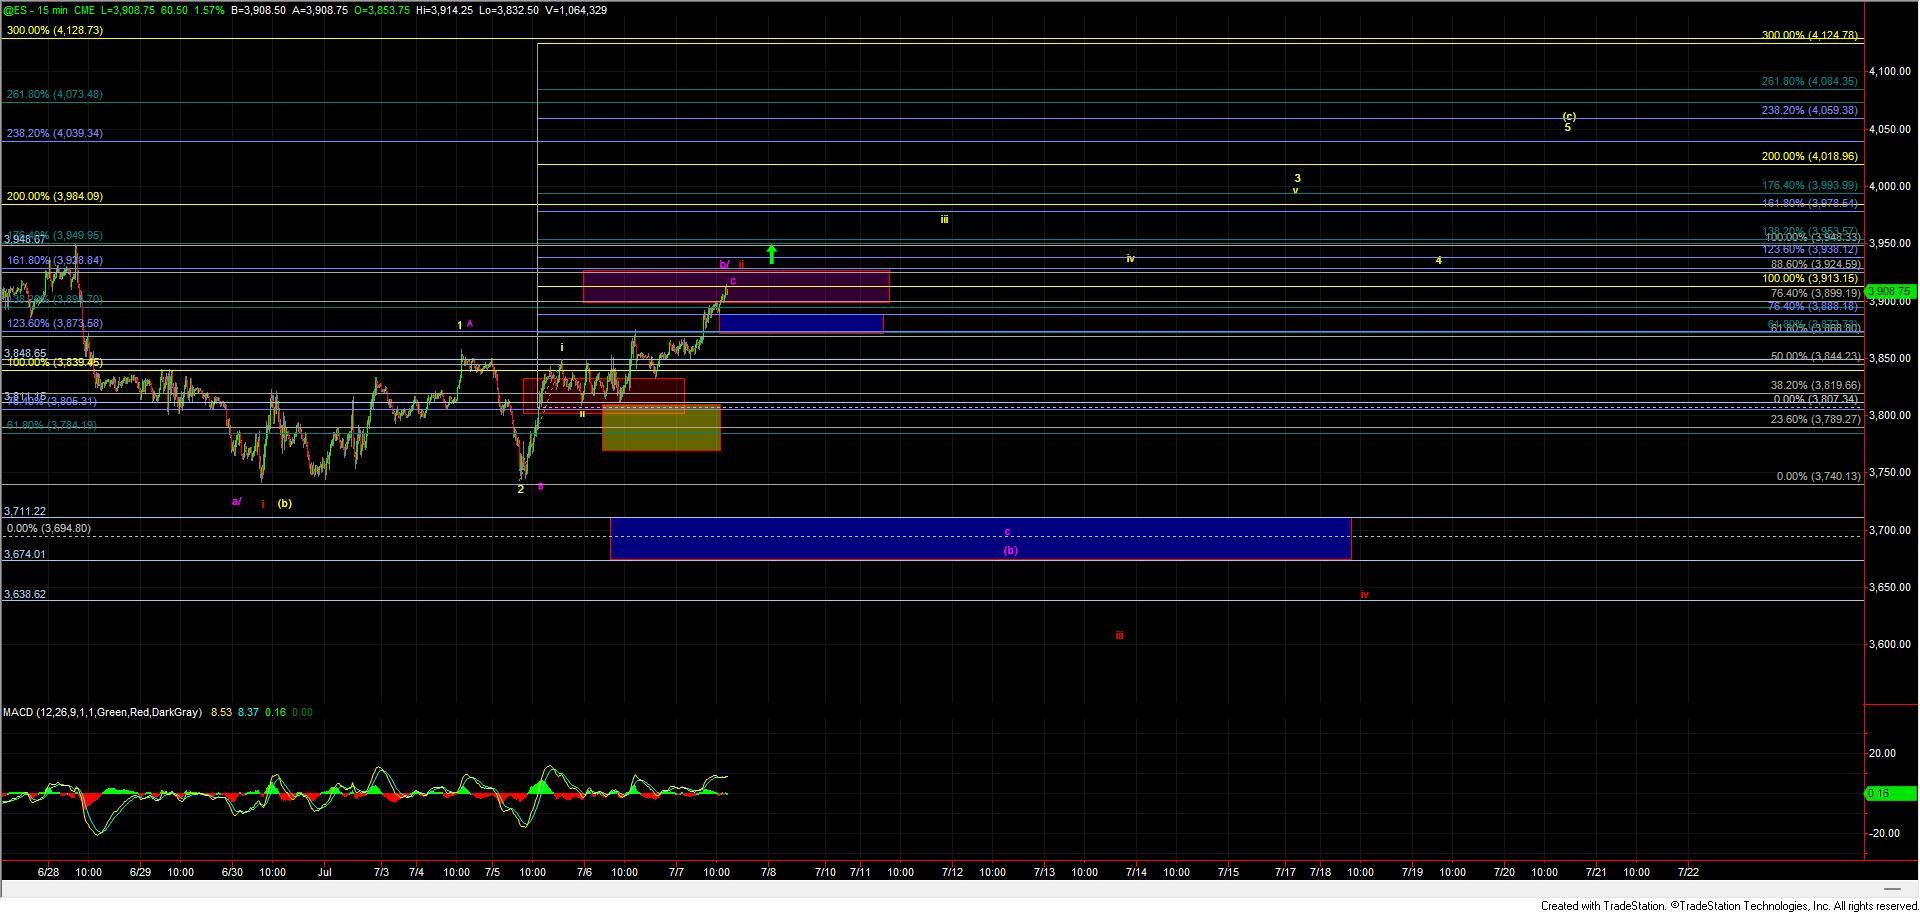
Today the market continued to push higher having now moved into the middle of the resistance zone that I had laid out for the purple and red counts and looking to close the session near the upper end of that zone. As I have been noting for the past several days I would view a push through this resistance zone as the next signal that we are indeed following the yellow count higher and ultimately going to see a push back up over the 3948 high on the ES as is laid out per that yellow count. If however, we are unable to clear the current resistance zone and see a failure in this region it still would allow for either the purple or red count to see lower levels before pushing back up over the 3948 level on the ES.
Yellow Count
The yellow count is still the most immediately bullish count and would still suggest that we are in the process of seeing a wave (c) up with this current move being part of the wave iii of 3 up off of the lows that were struck on 6/30. This wave (c) would likey to be part of a larger corrective pattern or even part of a larger leading diagonal up off of the lows but in either case, it should see a move beyond the 3948 high on the ES and ideally target closer to the 4024-4097 zone. Under this case, we still need to see a push back up over the 3926 level which is the upper end of the resistance zone that I had laid out of the past several days. This would then need to be followed up with a push over the 3948 level and moving through that zone would then open the door to a move into the 3993-4050 region before topping out in the wave 5 of (c) up. The 100ext of the potential wave i of 3 of that C also lies right in the middle of that zone at the 3913 level and at the time of this writing we have yet to clear that level, so seeing a push through that zone would give another good signal that we may indeed see a direct break of that 3949 level while following the yellow wave 3 of C up. I am able to now move the micro support zone up to the 3888-3872 zone and ideally, I would want to see this zone hold if we are going to follow-through as an impulse for the yellow count. Breaking back below this zone would be a warning sign that the yellow wave (c) as an impulse may be failing. Under that scenario, the structure of the next leg down will be important and if we see a full five down off of the highs it would open the door to either the purple or red counts. If we were to see a break of that 3872 level on a corrective wave structure then it could be signaling that the yellow wave (c) is morphing into an ending diagonal but for now let's not get too far ahead of the count and first see if we can indeed hold that level.
Red Count
There really is not any change to the red count from yesterday and as I noted then while we did take out the nested i-ii (i)-(ii) with the breakout over the 3858 level I still cannot rule out that we are forming a larger i-ii to the downside as shown on the ES chart. This larger i-ii would take a very similar path to the purple wave b top in the beginning however the red count would project back down to new lows under the 3638 level whereas the purple count would hold those levels before turning higher once again. If we do break down below that 3638 level per this red count then we still would be projecting down towards the 3500-3450 zone below but again to open the door to this count we need to start the next leg down with a full five wave move.
Purple Count
The purple count would be following a very similar path to that of the larger i-ii down in red although instead of making a new lower low towards the 3500-3450 zone we would likey hold the 3712-3674 zone and bottom in a larger wave (b) before heading higher. This path would ideally top out around the 3863-3924 zone before moving lower in the wave c of (b). As noted above this path would start out very similarly to the larger red i-ii but again would not make a lower low and turn higher before breaking the 3639 lows. This may be the most painful path for both bulls and bears so it is one that I am keeping a very close eye on here as we move into the 3900-3926 resistance zone just overhead.
So the strong action today is certainly opening the door to this moving to new highs but I still need to see this get through the resistance zones noted above to give us further confirmation that we will indeed see another push over the 3948 level. Until that does occur I will remain a bit cautious here as I do have some issues with the overall structure of this wave action. We are however still quite oversold on the larger timeframes and have developed some good divergences on those larger timeframes so if this can finally get through resistance we certainly have the opportunity to see a continued move higher into next week.