Market in a Holding Pattern, but Risk Remains Elevated
 By
By
After moving lower earlier in the week, the market has held several key pivot levels over the past two trading sessions and has since retraced higher on what still appears to be corrective wave action. While we ended last week with a fairly clear five-wave move to the downside, confirming the start of this week’s move, the follow-through so far has not confirmed that we are in the heart of a third wave down. Instead, we continue to hold several key pivots that would need to break to validate that scenario. This leaves us with a number of potential paths in play as we head into a potential timing catalyst after the bell in the form of the NVDA earnings report.
I will outline the potential counts as I see them, along with the pivot levels to watch, which should help confirm which path is most likely playing out.
Yellow Count
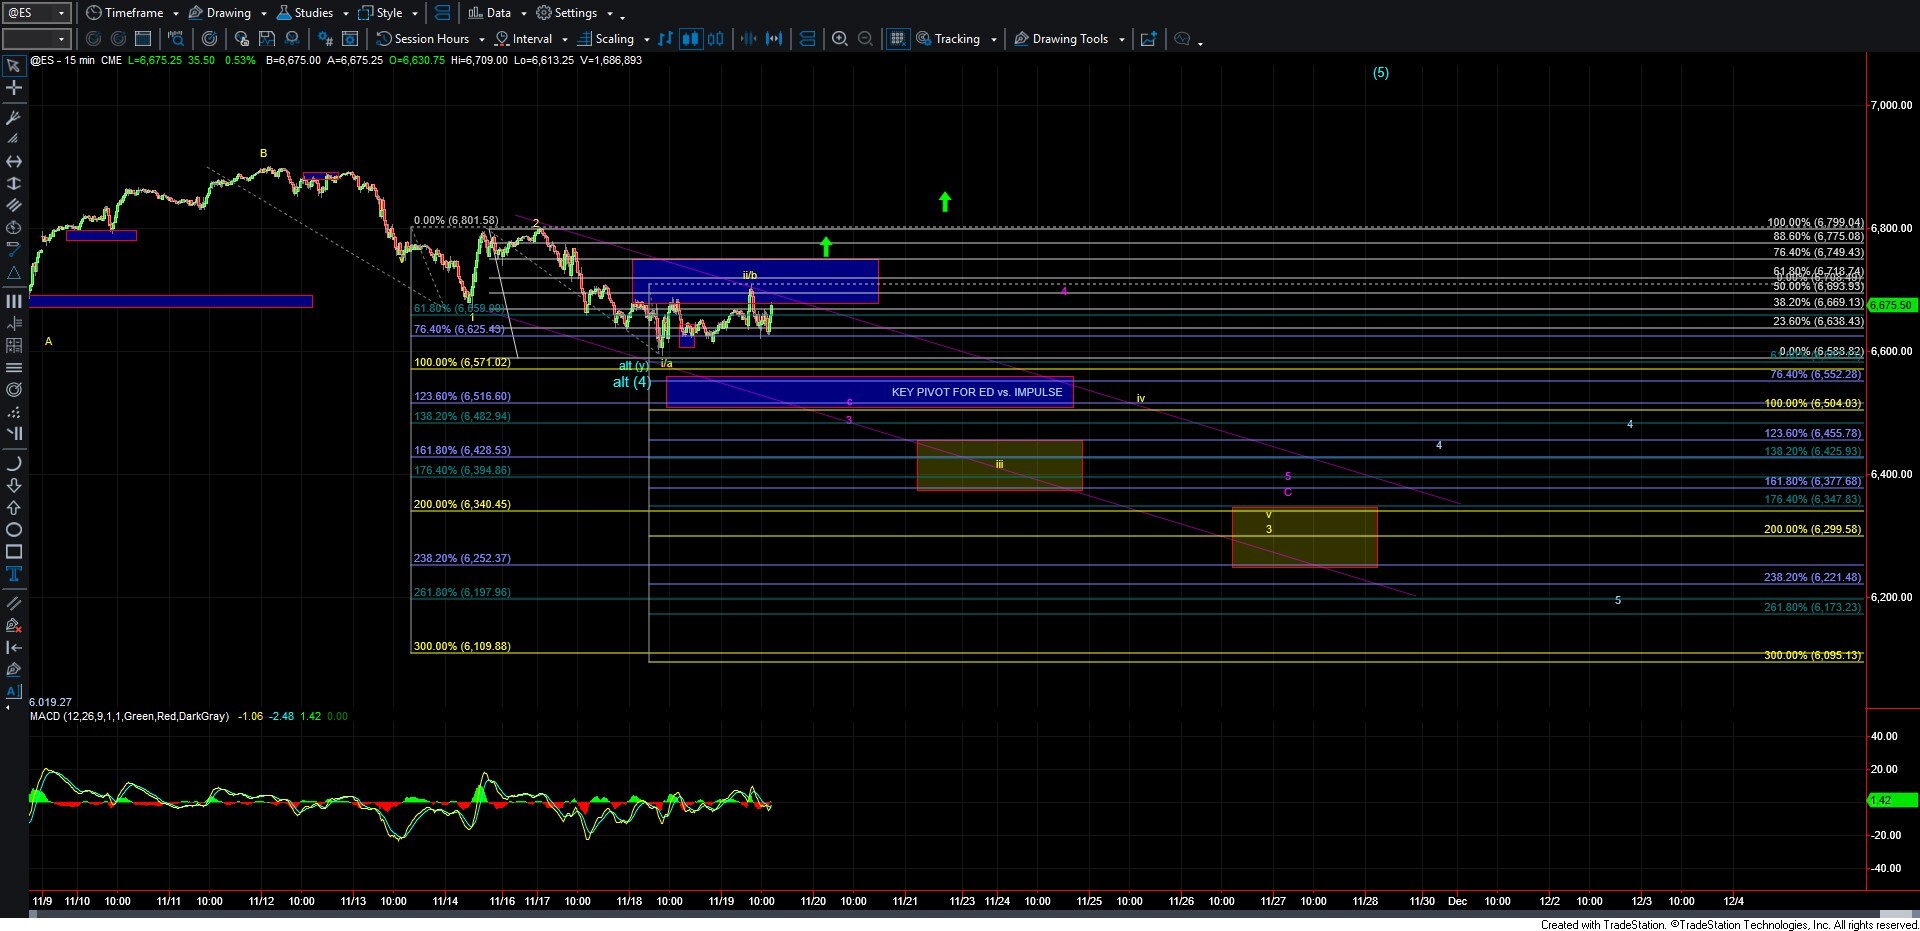
The count with the greatest downside risk is shown in yellow on my charts. Under this view, we would be starting a wave iii of 3 down, with the current move higher representing a wave ii of that 3. In this case, I would expect a continued move lower targeting the 6455–6377 region for wave iii of 3, the 6340–6299 region for wave v of 3, and potentially as low as the 6221–6173 region for wave 5 of C.
We would need to see a sustained break under 6504, to confirm that we are indeed following this path. Once that occurs, we should be on our way toward the wave iii target zone in the 6455–6377 region. From there, we would follow our fib-pinball guidelines as the price continues lower.
Purple Count
The purple count still expects a push lower to complete wave C. Under this scenario, instead of an impulsive structure, we would be looking at an Ending Diagonal finishing the wave C to the downside. If this path is in play, I would expect the 6522–6504 region to hold for the wave c of 3. After that, a wave 4 retrace back toward the 6650 region would be likely, followed by another move lower to fill out wave 5 of C before the ABC off the highs completes.
Blue Count
The blue count suggests that we may have already put in a bottom in wave (4), with another push higher yet to come. This currently appears less likely, as it would require the move down to be counted as a more complex WXY pattern. For this count to gain validity, we would need to see a break back over 6749, followed by a break over 6799 overhead.
Of the three patterns, I am viewing the yellow and purple counts as the most likely outcomes at this time. The 6552–6504 pivot zone below will be the key region to watch and should help guide us as to which of these paths the market is following.
Of course, if we fail to move lower and instead break over the levels noted in the purple count, then the market would have had different intentions, putting in a bottom via a less reliable and more complex WXY correction.
For now, the market has done an excellent job keeping us in suspense ahead of the potential after-hours timing catalyst, but we should have much more clarity on which path is unfolding before the week is out.