Market VERY Full To The Upside
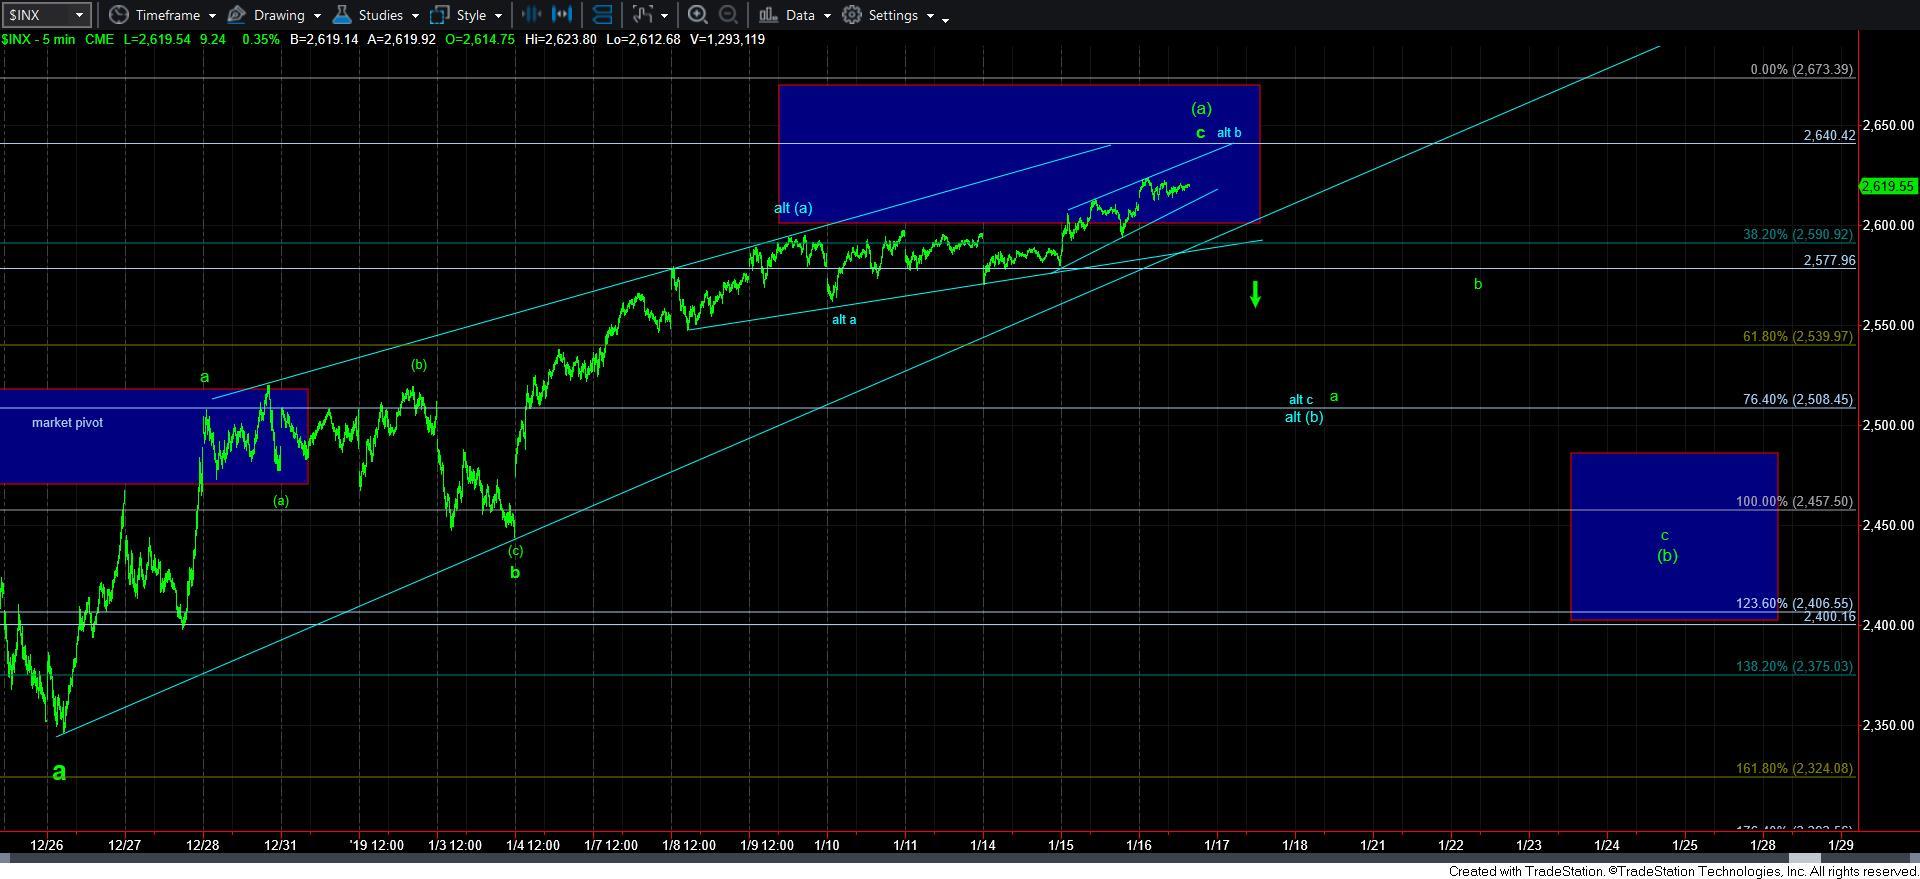
As we were hitting the 2600 initial resistance region on the S&P 500 (SPX), and the market was not breaking down, I was warning that the [a] wave off the lows may still try to extend, which is often seen when the market becomes as oversold as it did at the lows. Thus far, the market has certainly pushed that envelope.
Over the 2600 region, I have been noting that the 2640 region provides us with the next major confluence point, as that is where the a=c is represented based upon the futures, which hit lower levels than did the cash SPX chart. For now, it seems we are trying to stretch to that point, but I am really questioning whether the market has enough strength to take us there.
As I write this update, the market seems to be in a smaller triangle. Triangles most commonly occur in 4th waves, and suggest we are about to see a final move in the trend within which that triangle resides. That likely means we see a 5th wave higher to complete this c-wave of the [a] wave, assuming my wave count is correct.
I am also leaving the alternative as presented in blue, which I reviewed last night. Should we see a clear 5 wave structure to the downside off a high we strike up here, then I will view this potential as a much higher probability. For now, it remains an alternative count.
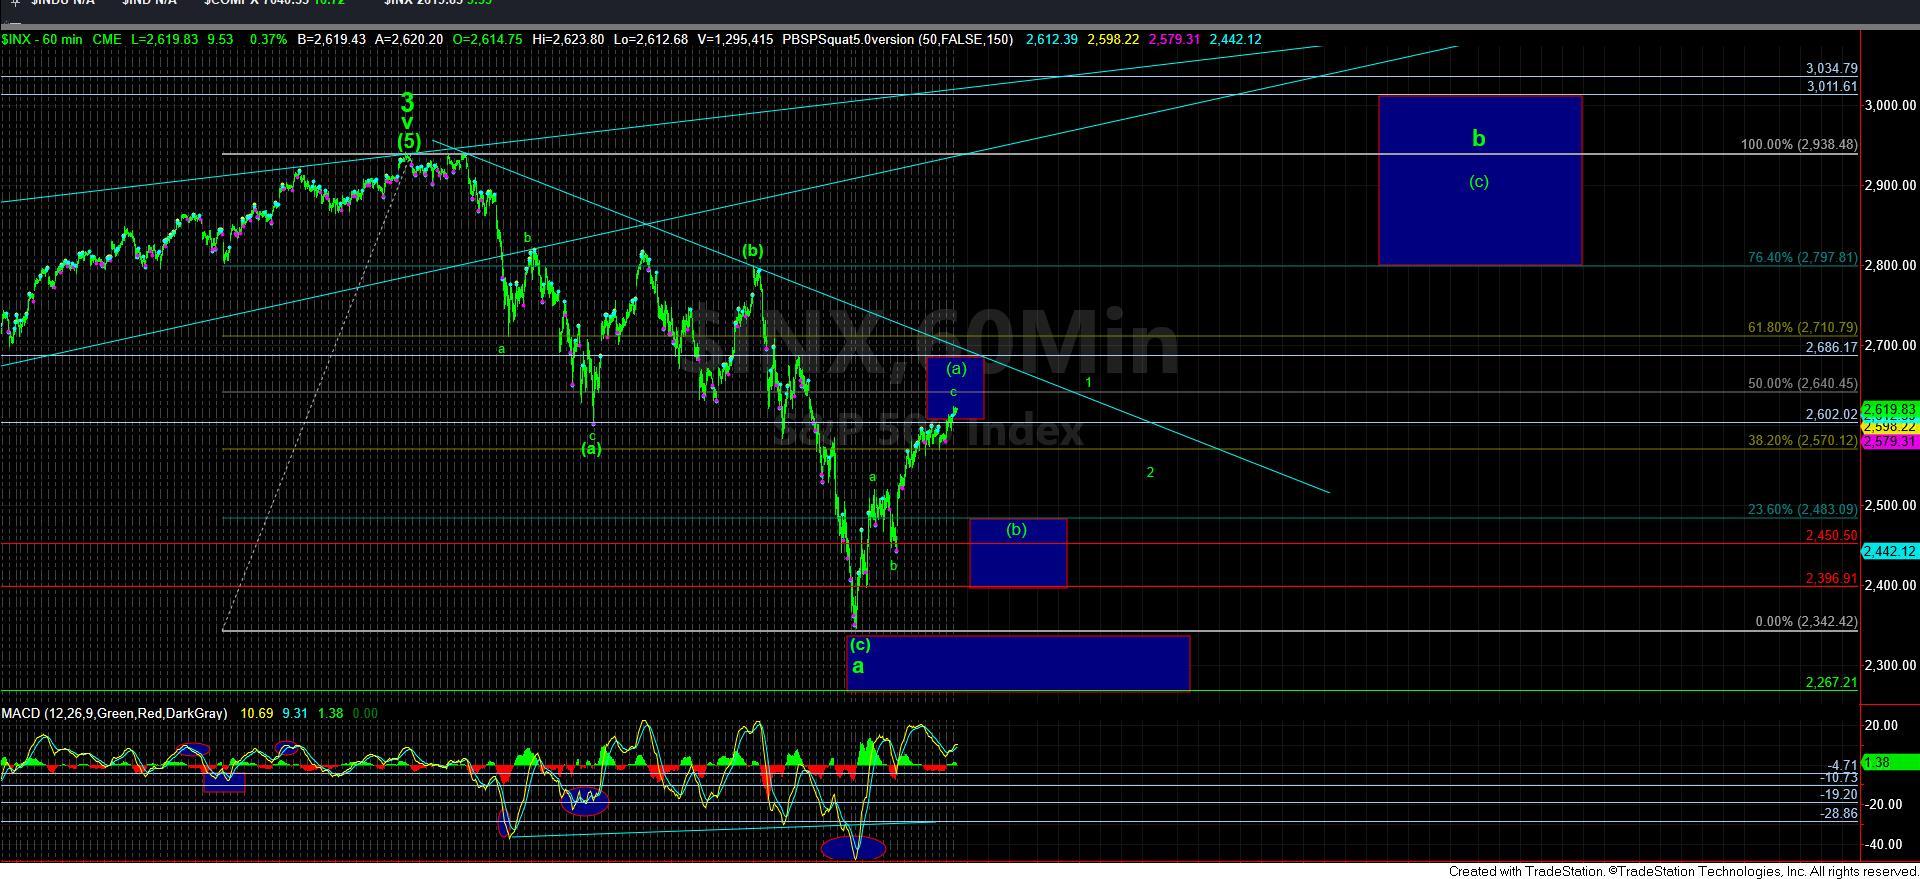
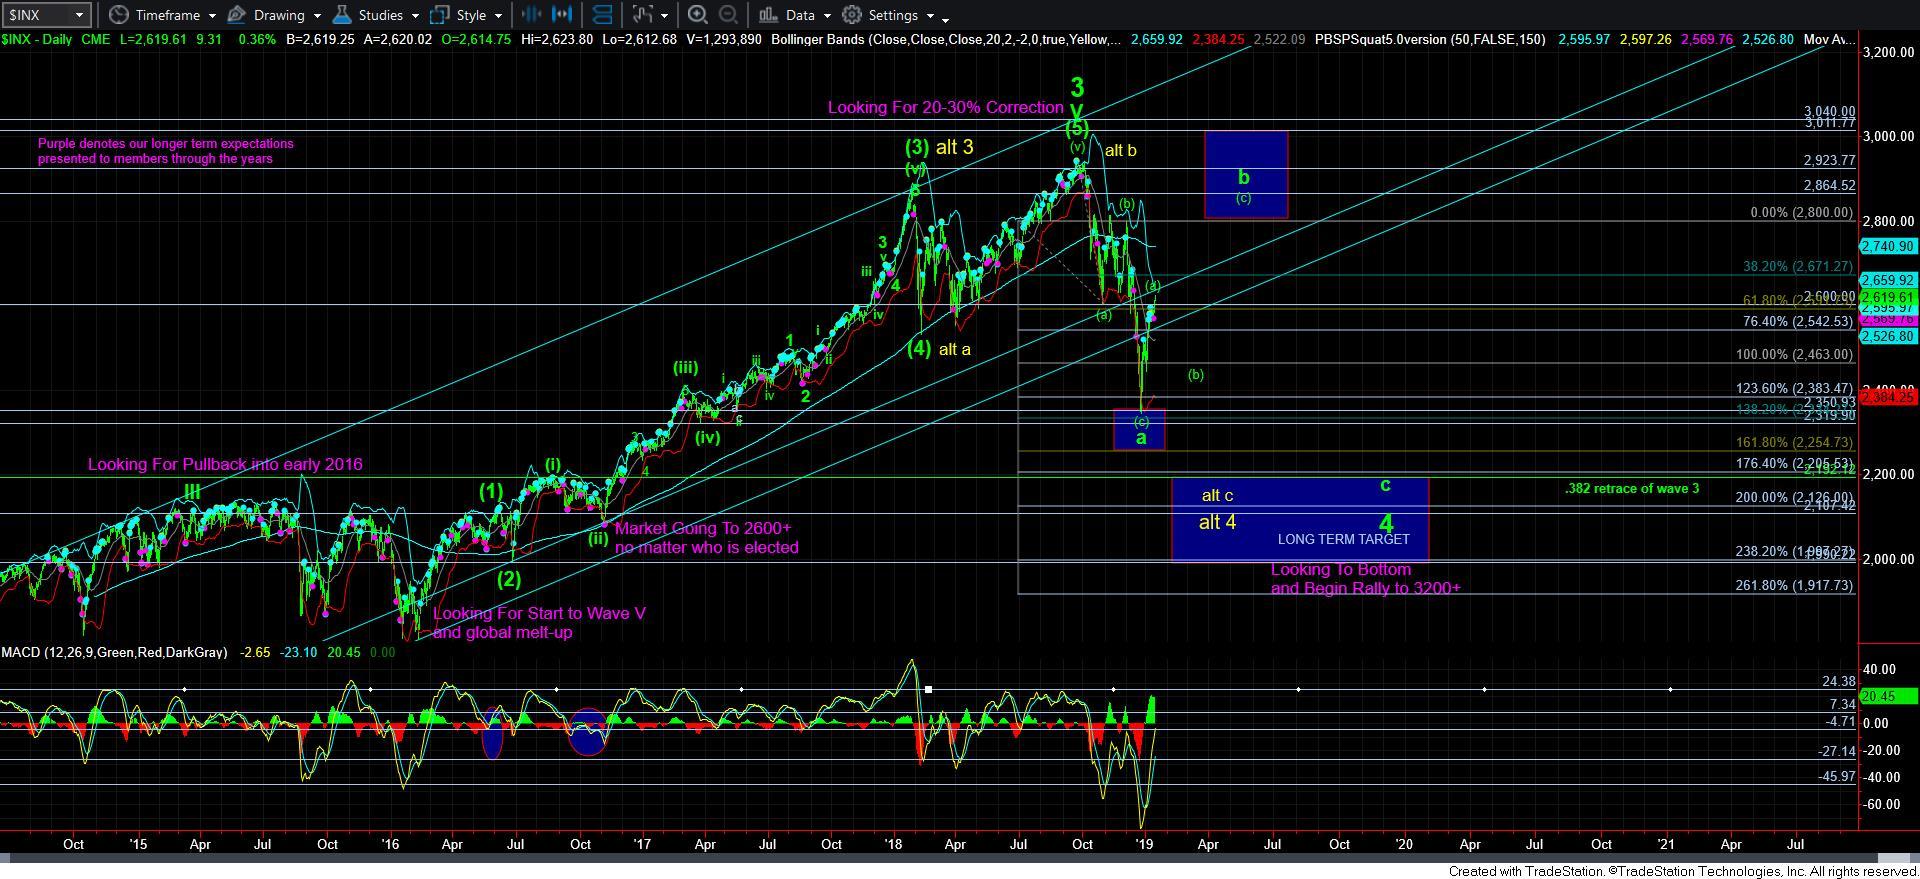
For now, the market still has to break down below 2575/80 support to suggest we are in the [b] wave pullback. And, as you can see from the 60-minute chart, my expectation still remains that we see another rally into the spring before we complete the b-wave rally off the December of 2018 lows. Ideally, I still also think that we reach at least the 2800SPX region, since that provides us with the most confluence with the larger degree 2100-2200 region target below.