Market Trying To Decide If It Topped
Yes, I know that I still have no clear indications that the market has topped. And, until I get stronger indications, I am forced to continue to look higher for one more extension.
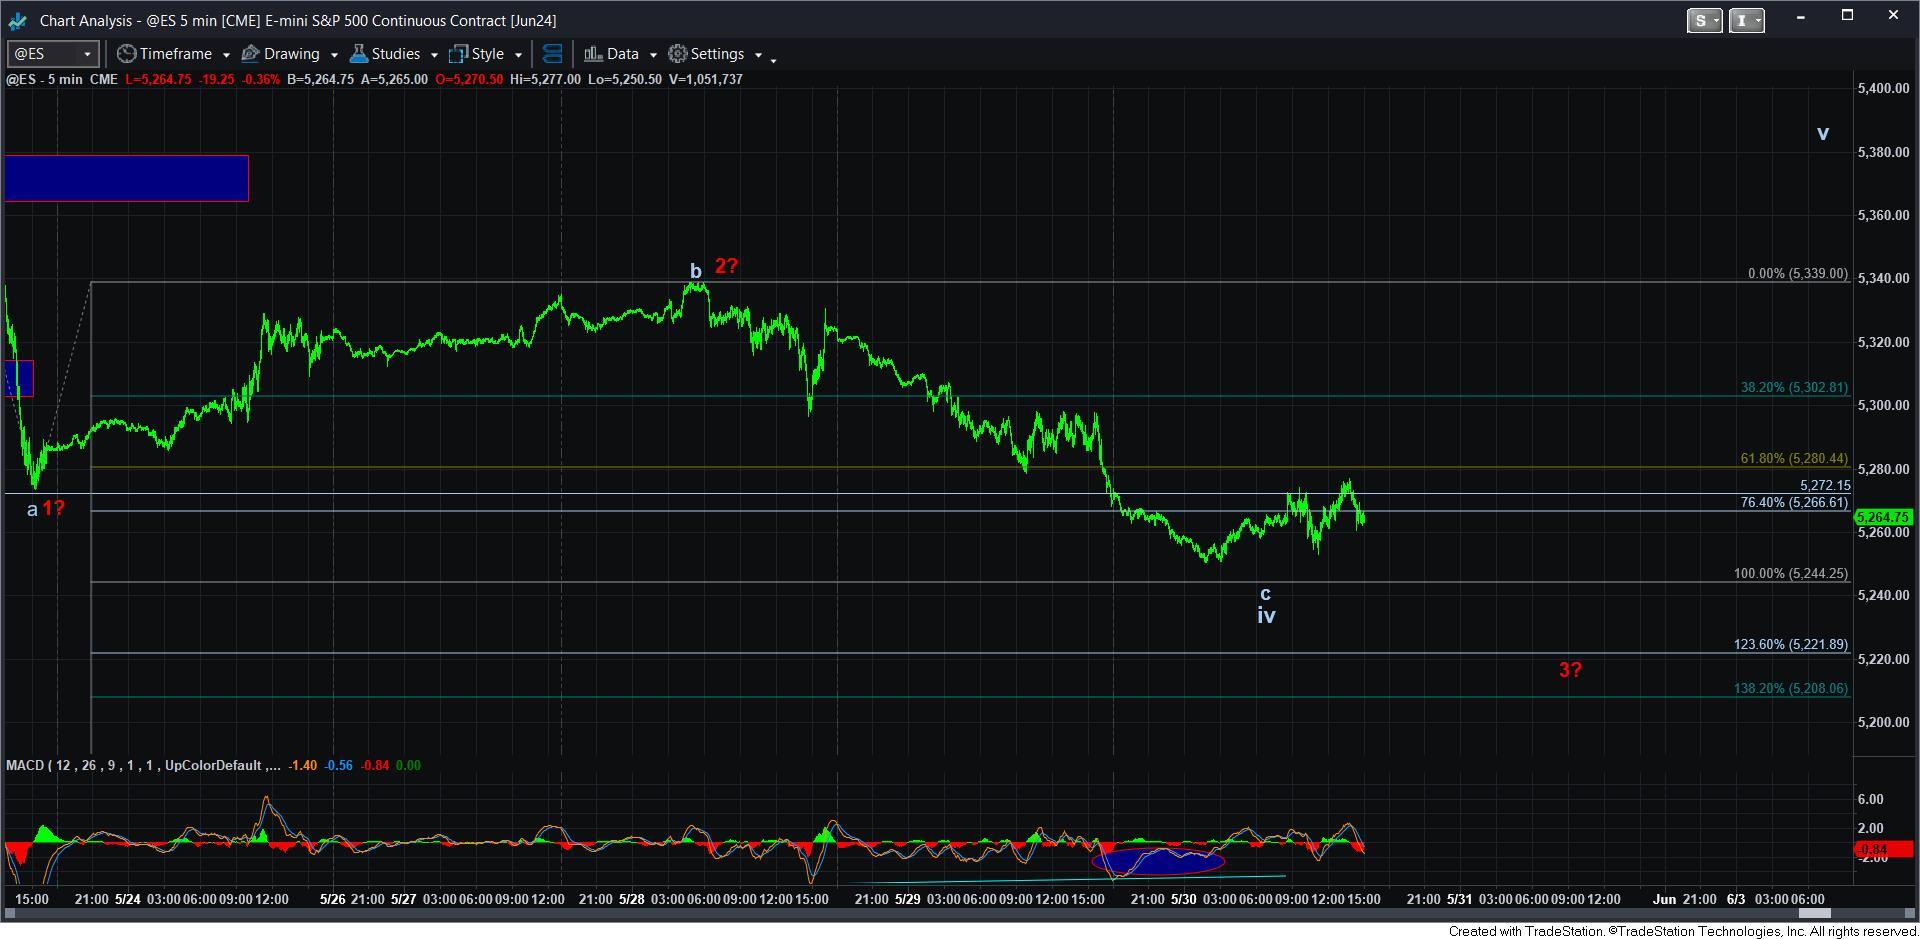
So, I am going to include the ES chart this afternoon. The main reason is because the ES had a bit higher of a high struck of late as compared to the SPX, and the a=c projection on that chart is a bit more "conservative" for support reasons. Therefore, I am using it as my guide.
As you can see, as long as the market holds the 5244ES region, we have an a=c decline from the recent high, which would suggest that another higher high for wave v is likely sitting out there. The reason I am viewing it in this manner is because the initial decline off the recent all-time high was a rather clear 3-wave structure. Therefore, until this bull market dies, it is more reasonable to view it as part of an ongoing corrective pullback rather than having struck a top.
Now, of course, from an alternative standpoint, if we began with a 3-wave decline, we MAY be able to view the structure as starting a leading diagonal down, which I am presenting in red on the ES chart. However, as many of you know, I do not rely upon leading diagonals for trading cues unless I have other reasons to do so. They too often are corrective structures which is why I do not rely upon them primarily.
In this case, in order for me to even consider the leading diagonal structure, we would need to break down below the a=c support of 5244, and drop down to the 1.236 extension of the red 1-2 structure. The 1.236 extension is often a standard target for a 3rd wave in a diagonal. But, we would still have waves 4 and 5 to fill in to give us a bit more evidence of a top being struck.
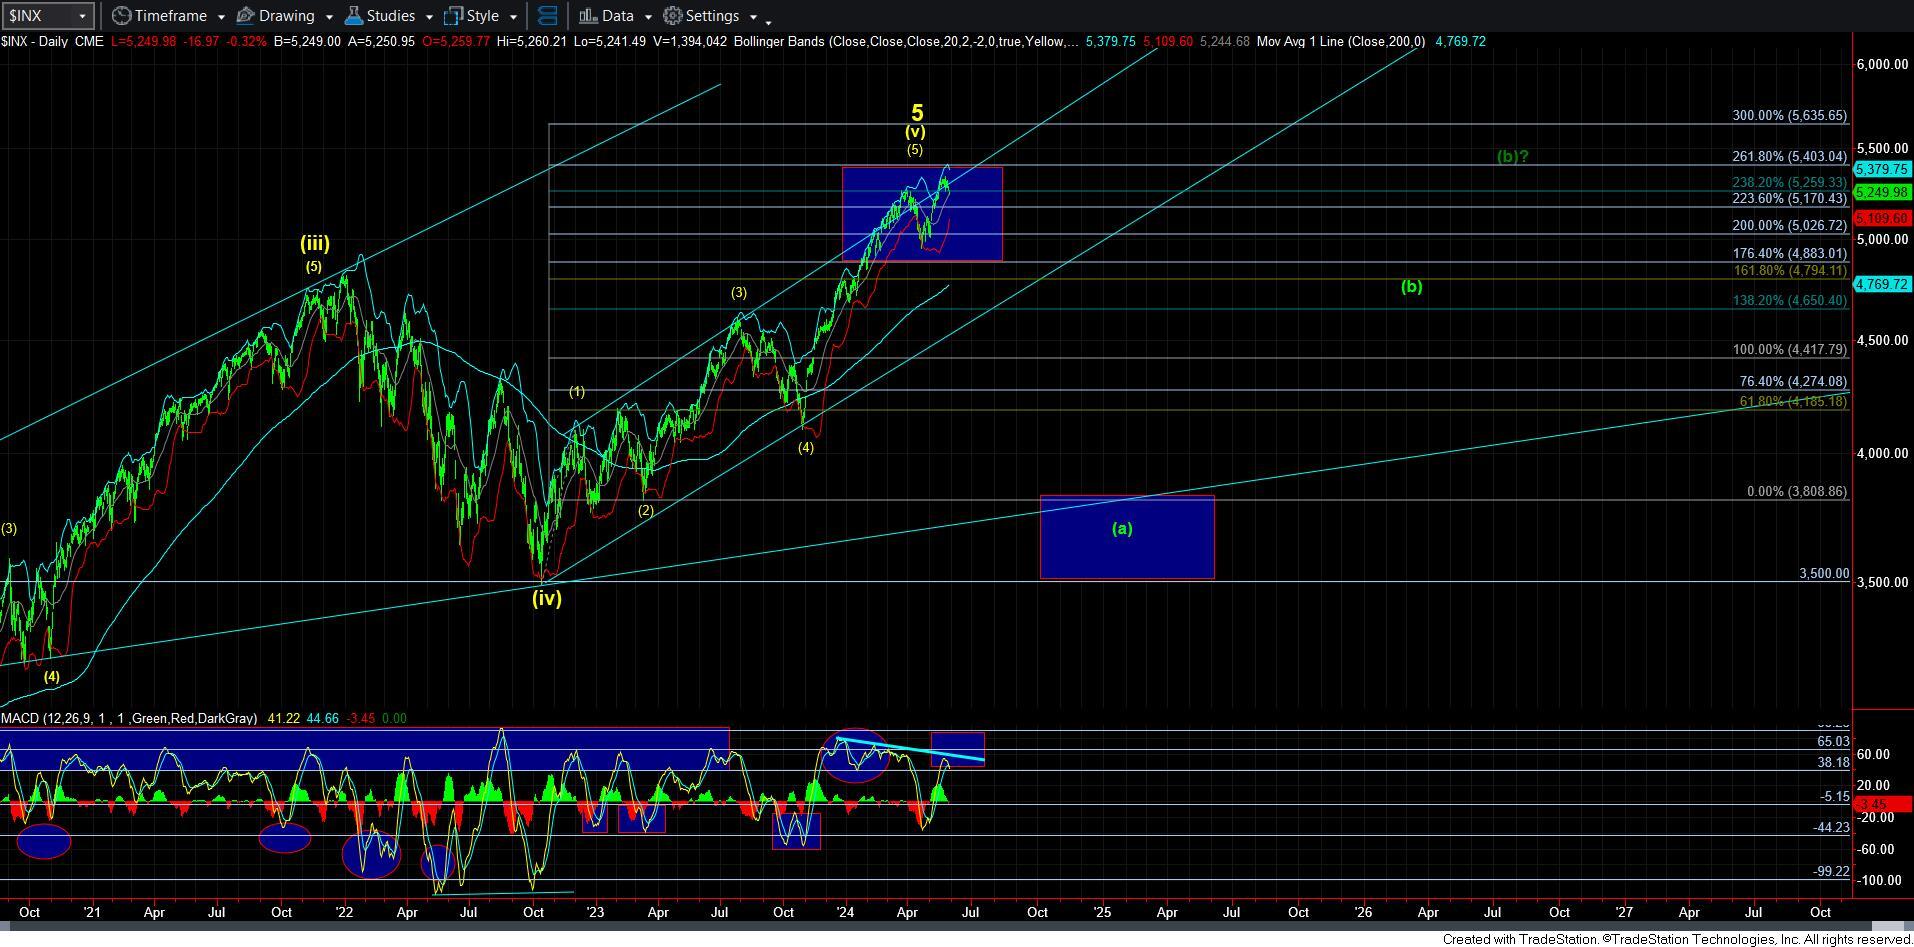
So, for now, I think the more reasonable path is to look higher, until the market provides us more evidence that the top is indeed in place. A POSSIBLE leading diagonal structure is not enough evidence for me at this time, especially since we still remain over a reasonable a=c support level . . for now. But, I will end this missive with noting that the daily MACD has now begun to turn down, after providing us with a negative divergence during this rally, right into our resistance region. So, its time to watch for additional clues.