Market Trying For 5
With today’s continued push higher in the market, it really looks as though it is trying to complete that 5 waves up off last week’s low. Yet, as it stands today, we are only completing a very extended wave iii. But, I guess what else is new in this market, as everything to the upside has extended, whereas downside structures have not reached their standard targets or completed their standard patterns for quite some time.
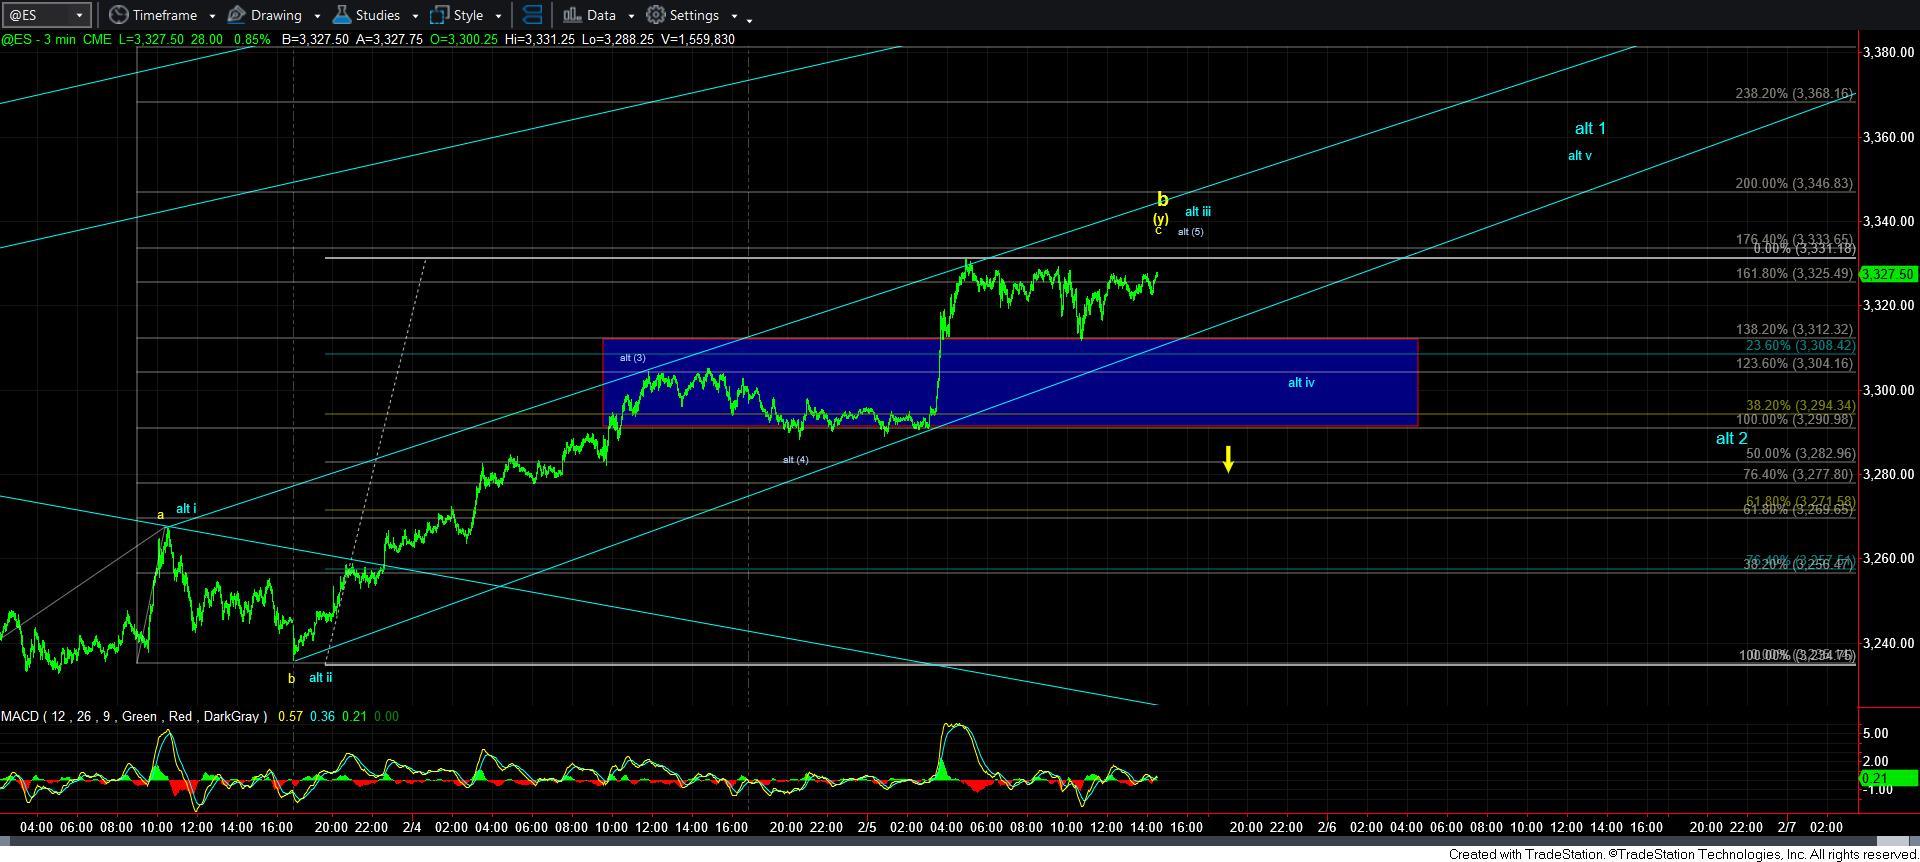
So, for now, as long as the ES remains over the 3290ES level, I am looking for waves iv and v to potentially complete the blue count on the 5-minute ES chart.
However, I want to warn you that if we are unable to complete 5 waves up, and, instead, we break down below 3290ES, that will open the door to swing down again for a c-wave of the larger degree wave [4].
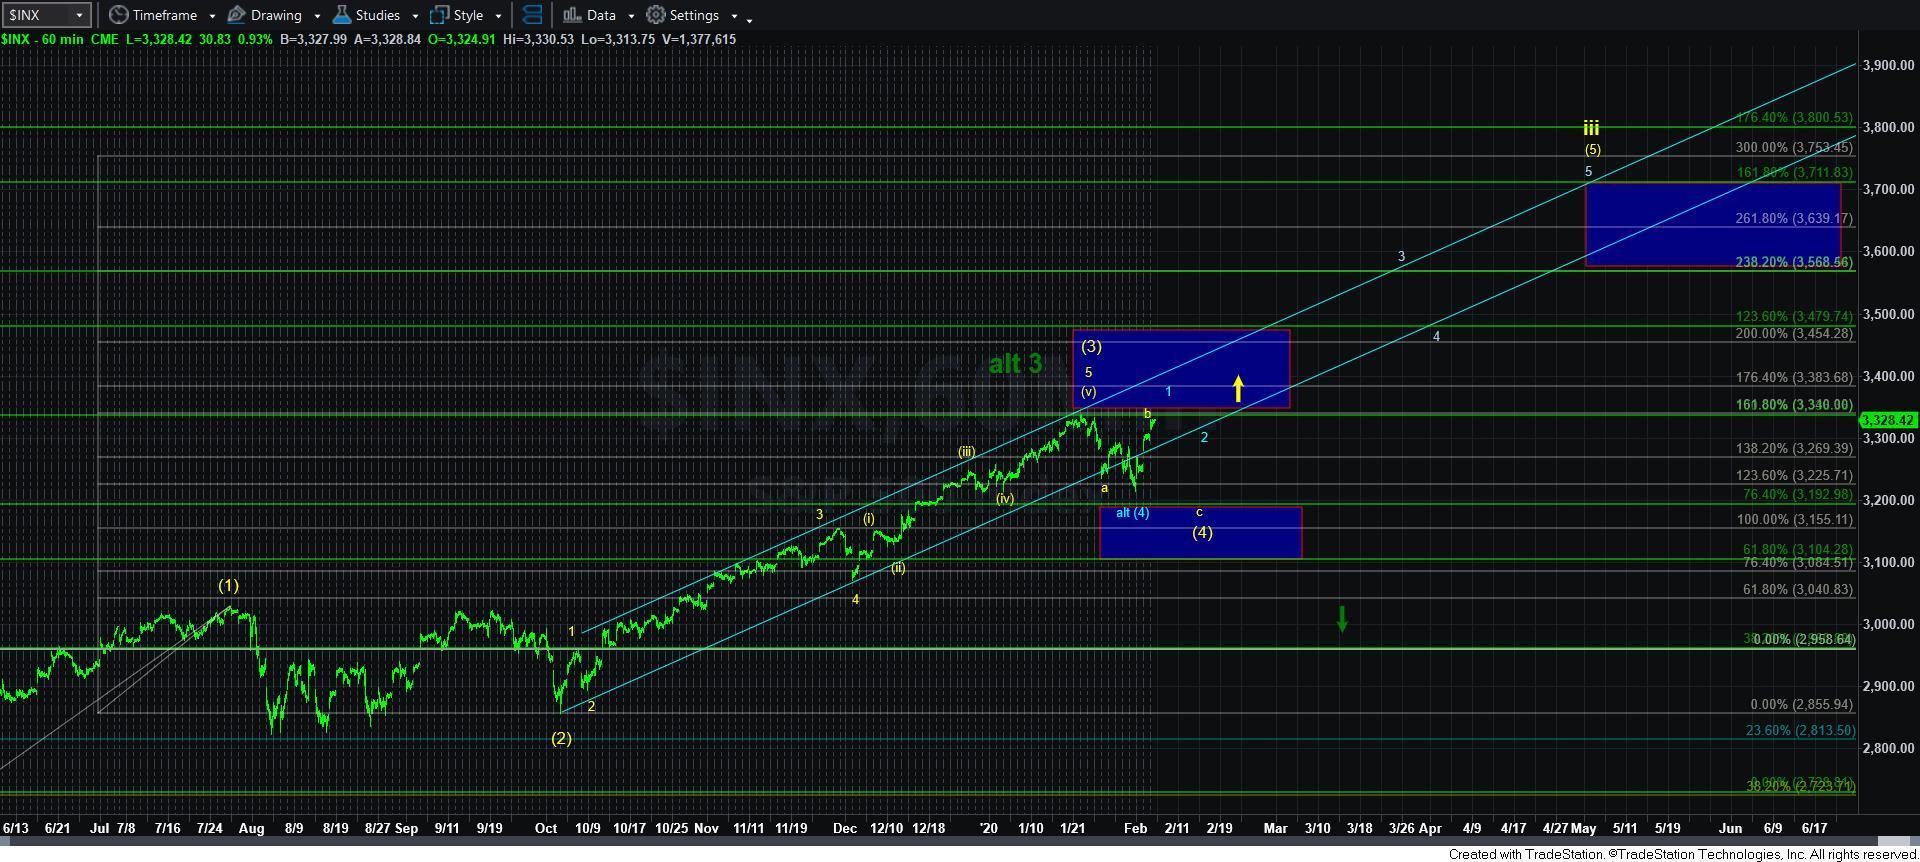
Now, should we complete 5 waves up over the coming days, then that would normally be a very bullish indication for the market. I would primarily classify that as wave 1 of wave [5] of wave iii, as shown on the 60minute chart. In fact, as I noted in an alert yesterday, should we complete 5 waves up, we will likely see a higher high for that 5-wave structure. This would be needed to develop a 1-2 structure which can project a 5-wave structure to the 3711 region, which is our ideal target for wave [5] of iii.
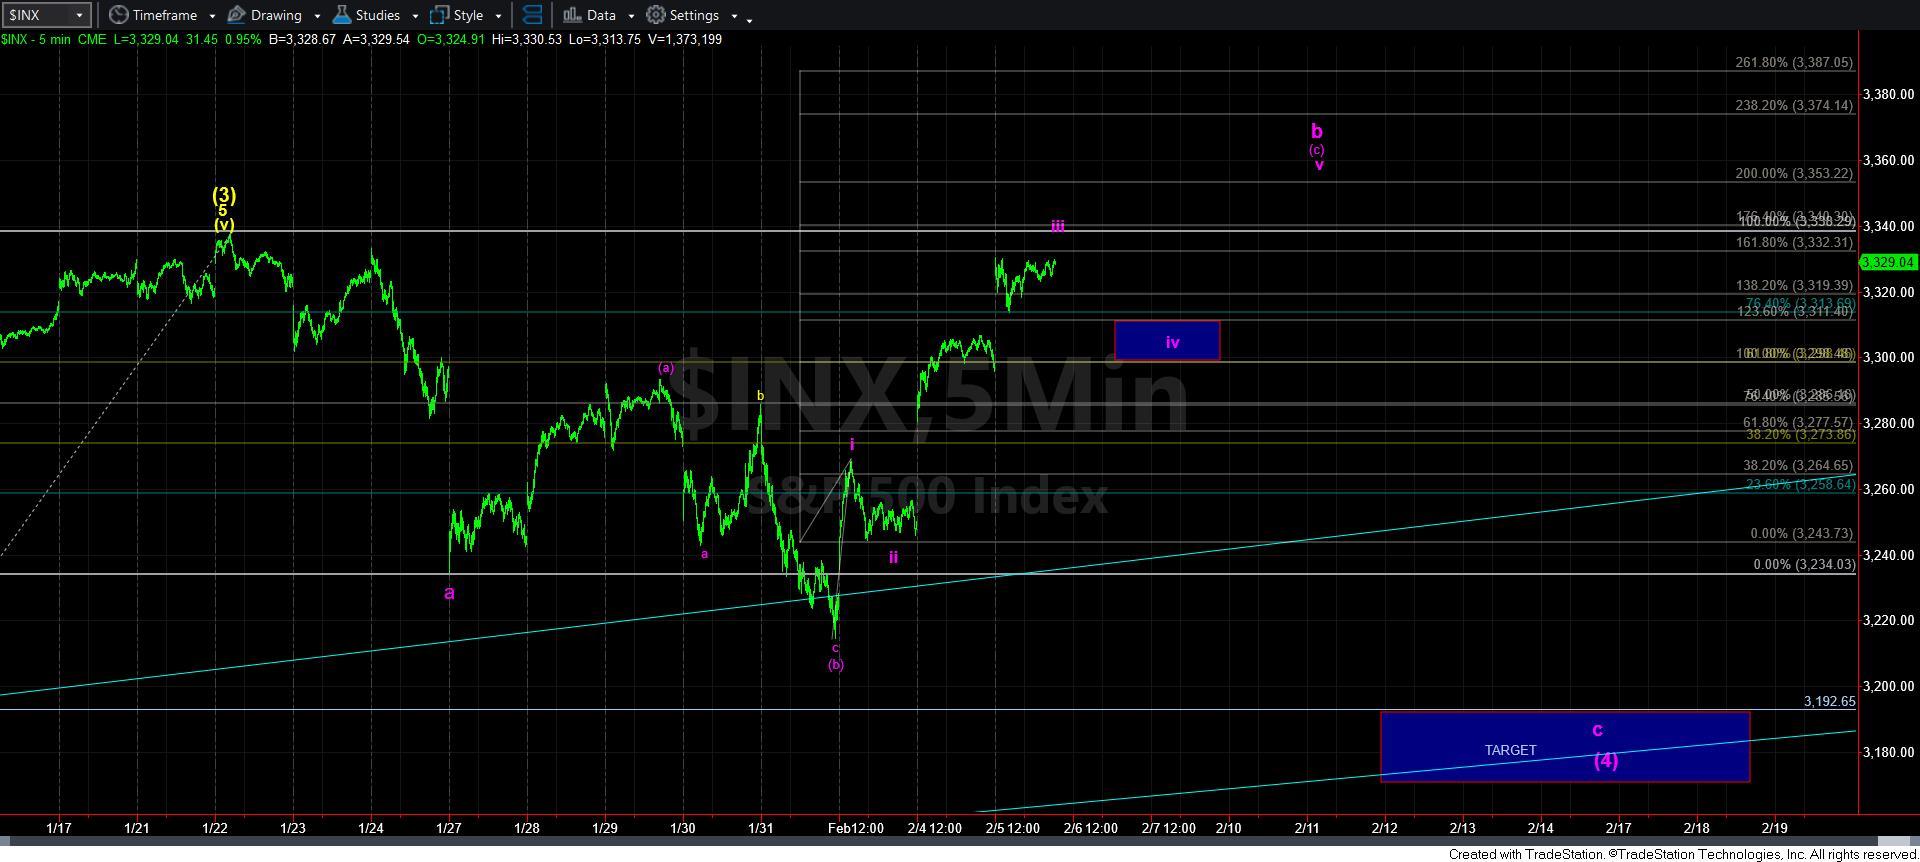
Yet, there are several things that still trouble me, and keep the potential for a c-wave down in wave [4] on my charts. First, if we are unable to complete 5 waves up and then break down below 3290ES, we will likely point down in the c-wave lower towards the 3155-3192 target region.
Secondly, Luke Miller, who runs our Bayesian analysis service, noted that there is an 82% probability that the c-wave does take us down. When I consider that probability along with the lack of a solid bottoming structure last week (only on 3 waves), as well as the fact that we did not even hit our support on the SPX, I still cannot discount this potential if the market begins to prove this to be the case.
What that means is if the market breaks down below 3290ES before completing 5 waves up, then this pattern will remain my primary. Moreover, even if we do complete 5 waves up, I have attached an alternative in purple on the 5-minute SPX chart which would only be applicable if we dropped in a 5-wave structure off the high we strike after completing 5-waves up.
Again, this would be an ALTERNATIVE that would have to be confirmed with a clear 5-wave decline off that high. Otherwise, if the market completes 5-waves up, and pulls back correctively, and thereafter rally’s over the high we strike in the initial 5 waves up, that is a VERY bullish indication and likely going to be pointing us higher for the next few months, as shown by the yellow arrow on the 60minute chart.
So, for the next 24 hours or so, the 3290ES level is going to be very important. As long as we hold over it, and see a 4th wave consolidation over that level, then we have the potential to complete 5 waves up off last week’s low. But, if we break down below that level before we are able to complete 5 waves up, it would suggest that we can still decline towards our lower targets below, even though we have come up through the 3311 resistance. So, due to how high we have rallied, the market MUST prove its intentions for another loop lower by breaking down below 3290ES before completing 5 waves up.
But, keep in mind, even if we drop down to our lower targets, it still keeps us in a very bullish posture, especially as long as we remain over the 3155SPX support. It still takes a break down below 3100SPX to turn this chart down in a meaningful way, for which I simply do not have any reasonable projection at this time.