Market Testing the Upper End of Micro Resistance
 By
By
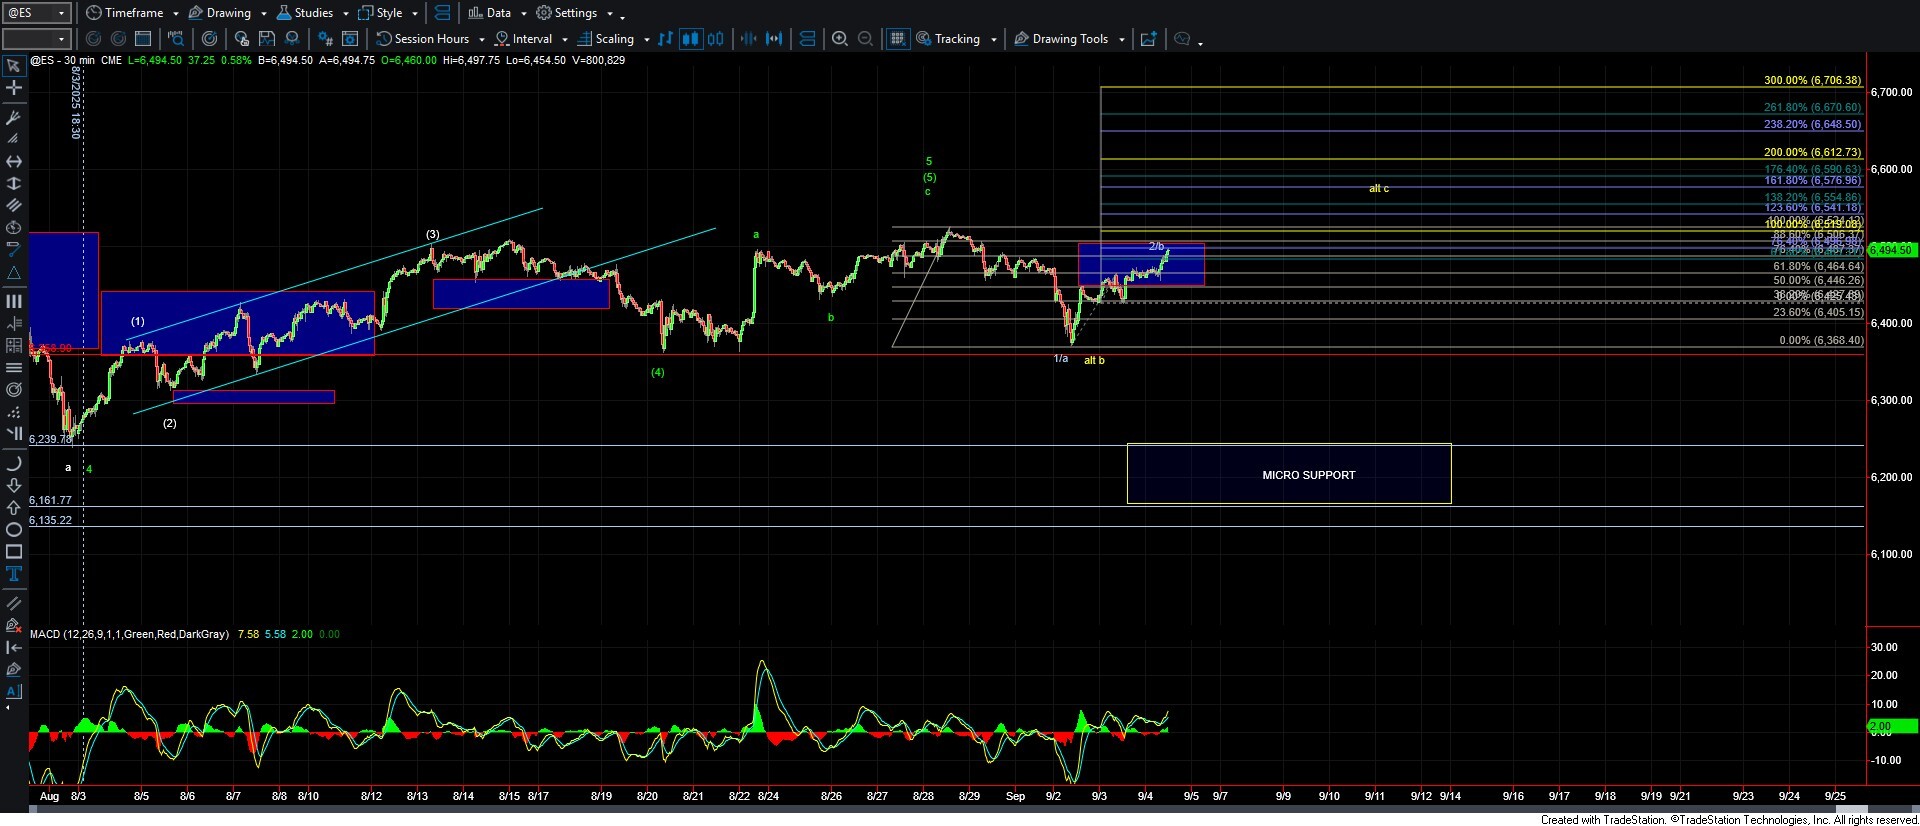
After last week’s pullback into Monday's session, the market has pushed higher over the past two sessions and is now pressing into the upper end of the standard retrace zone from the decline off the recent high. If the market can respect this upper Fibonacci retrace level, the door remains open for another leg lower, potentially in a wave c. However, a sustained break above this level would increase the likelihood of seeing another higher high before any meaningful top is found.
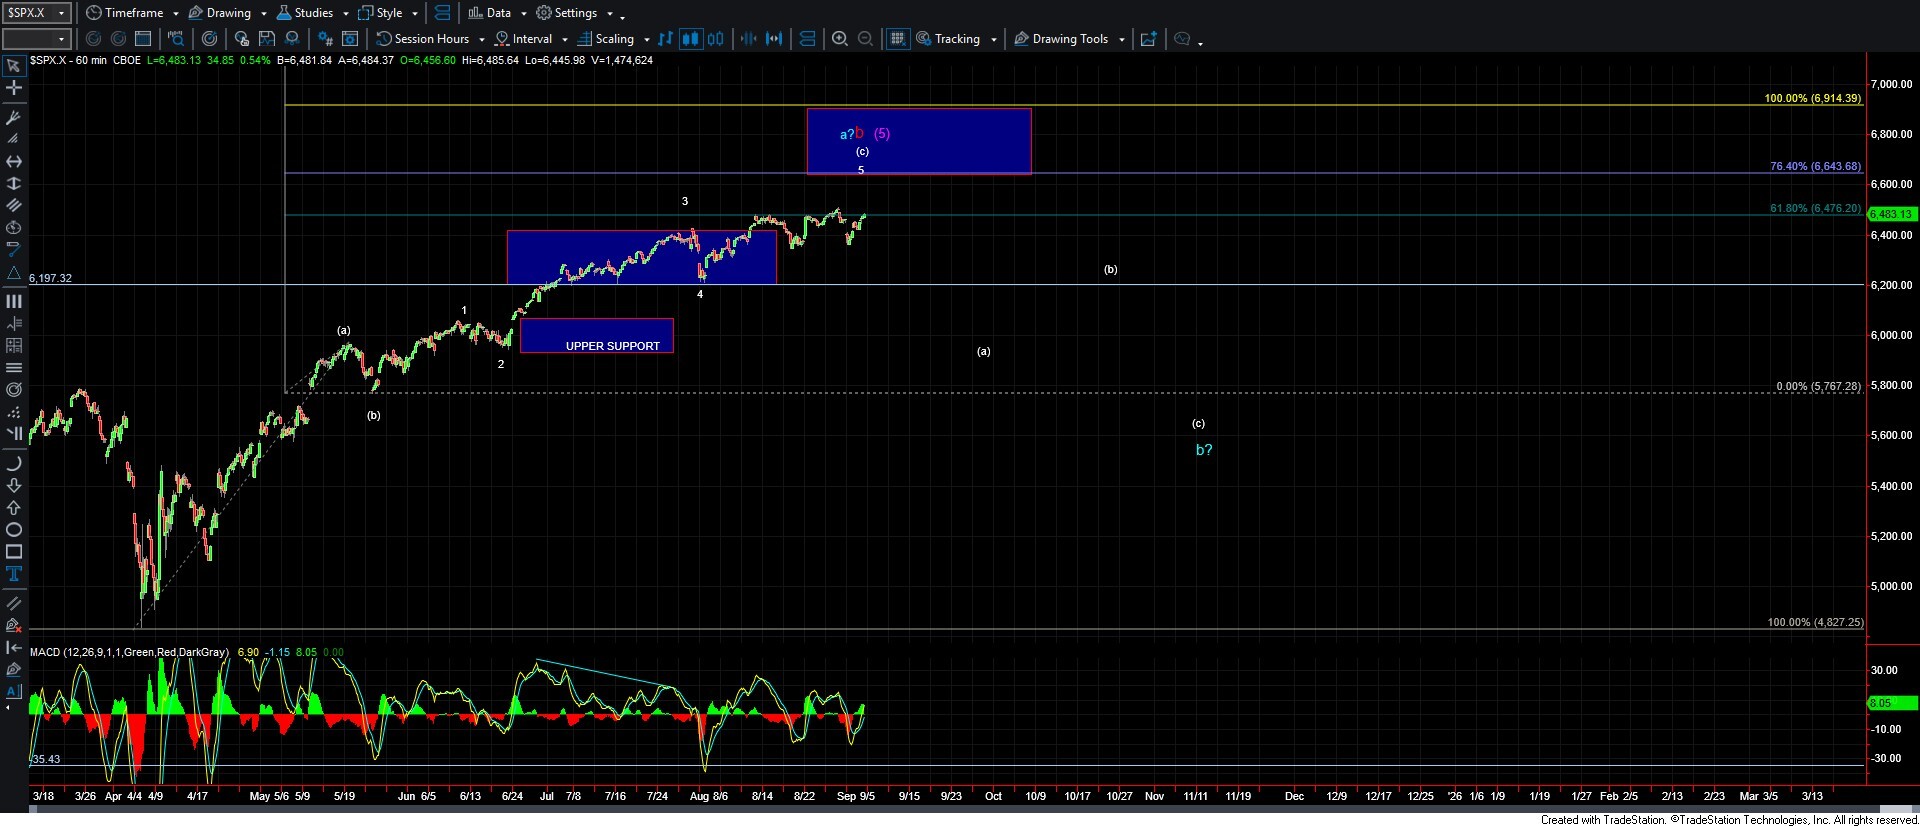
From a bigger-picture perspective, not much has changed from what we’ve outlined in prior updates and can be seen on the 60-minute chart. On the smaller time frames, the ES is now approaching the 88.6% retrace of last week’s decline at 6506. A break above that level would favor the yellow count and suggest further upside. If, instead, the market holds 6506 and turns back down below 6424, that would be the first indication of a potential local top, with further confirmation coming on a break under 6368. While a move beneath 6368 would open the door to test deeper supports, I would still want to see a break under the 6239–6161 zone before considering the possibility of a larger degree top being in place.
On the upside, if price can clear last week’s high, the focus shifts to the larger Fibonacci targets overhead on the SPX, which come in at the 6643–6914 zone.