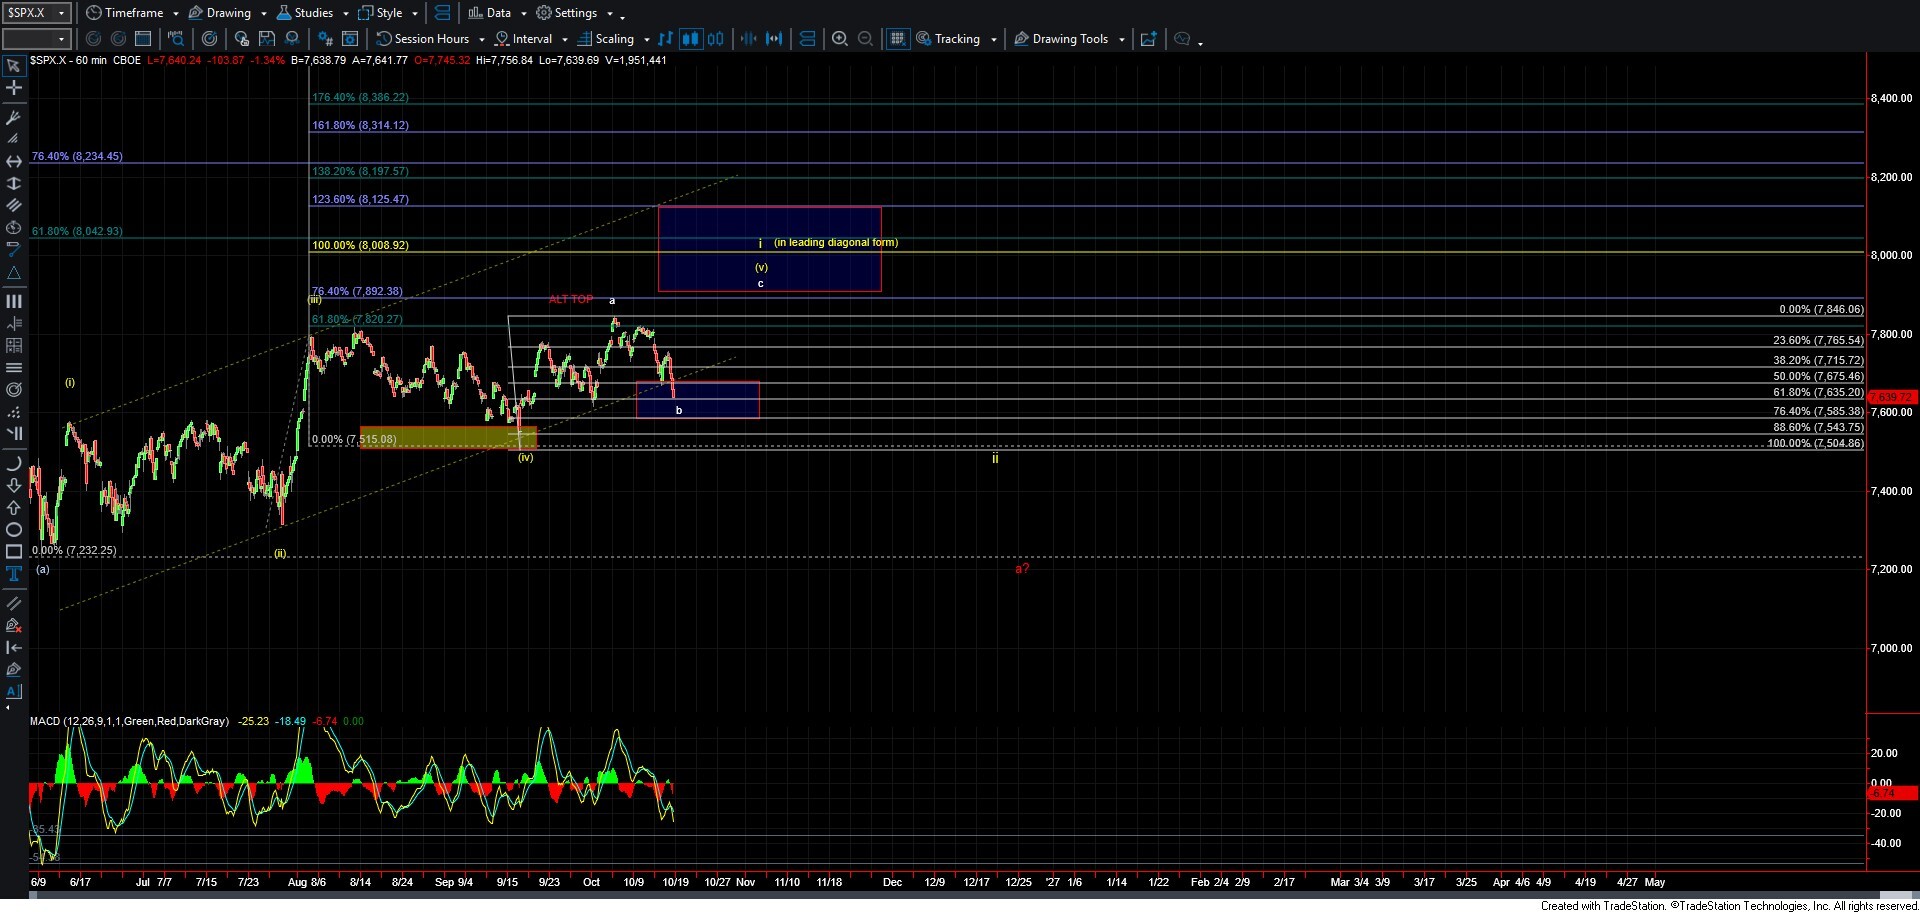
Market Testing the Lower End of Support
 By
With today's sharp drop, the risk of the market having already put in a top in the larger diagonal off of the June 9th low has certainly increased. We are currently testing the lower end of the key support zone for the potential wave b, as I am showing in white on the SPX chart. However, if we continue to push lower over the weekend and early next week, then we will have confirmation that we have indeed topped in all of the diagonal off of the June lows.
For now, I will be keeping a very close eye on the 7585 level below, which represents the 76.4% retracement level from the move up off of the September 16th low. If that breaks, it will further increase the odds that we have put in a top. Final confirmation would come with a break under the 7504 low, which represents the bottom of the wave (iv) of the diagonal.
If we are going to see another push to new highs, we will need to see a very clear five-wave move to the upside to indicate that we have begun the final wave c of (v) up. If we do not see that, then it will further suggest that a top has indeed been struck.
Once we do top in that diagonal off of the June lows, we will still have to determine whether that was a Leading or Ending Diagonal, as previously discussed. For now, however, I will remain focused on how the market reacts at the support levels noted above to give us an indication as to whether at least a local top has been struck.