Market Testing The Lower End Of Upper Support
 By
By
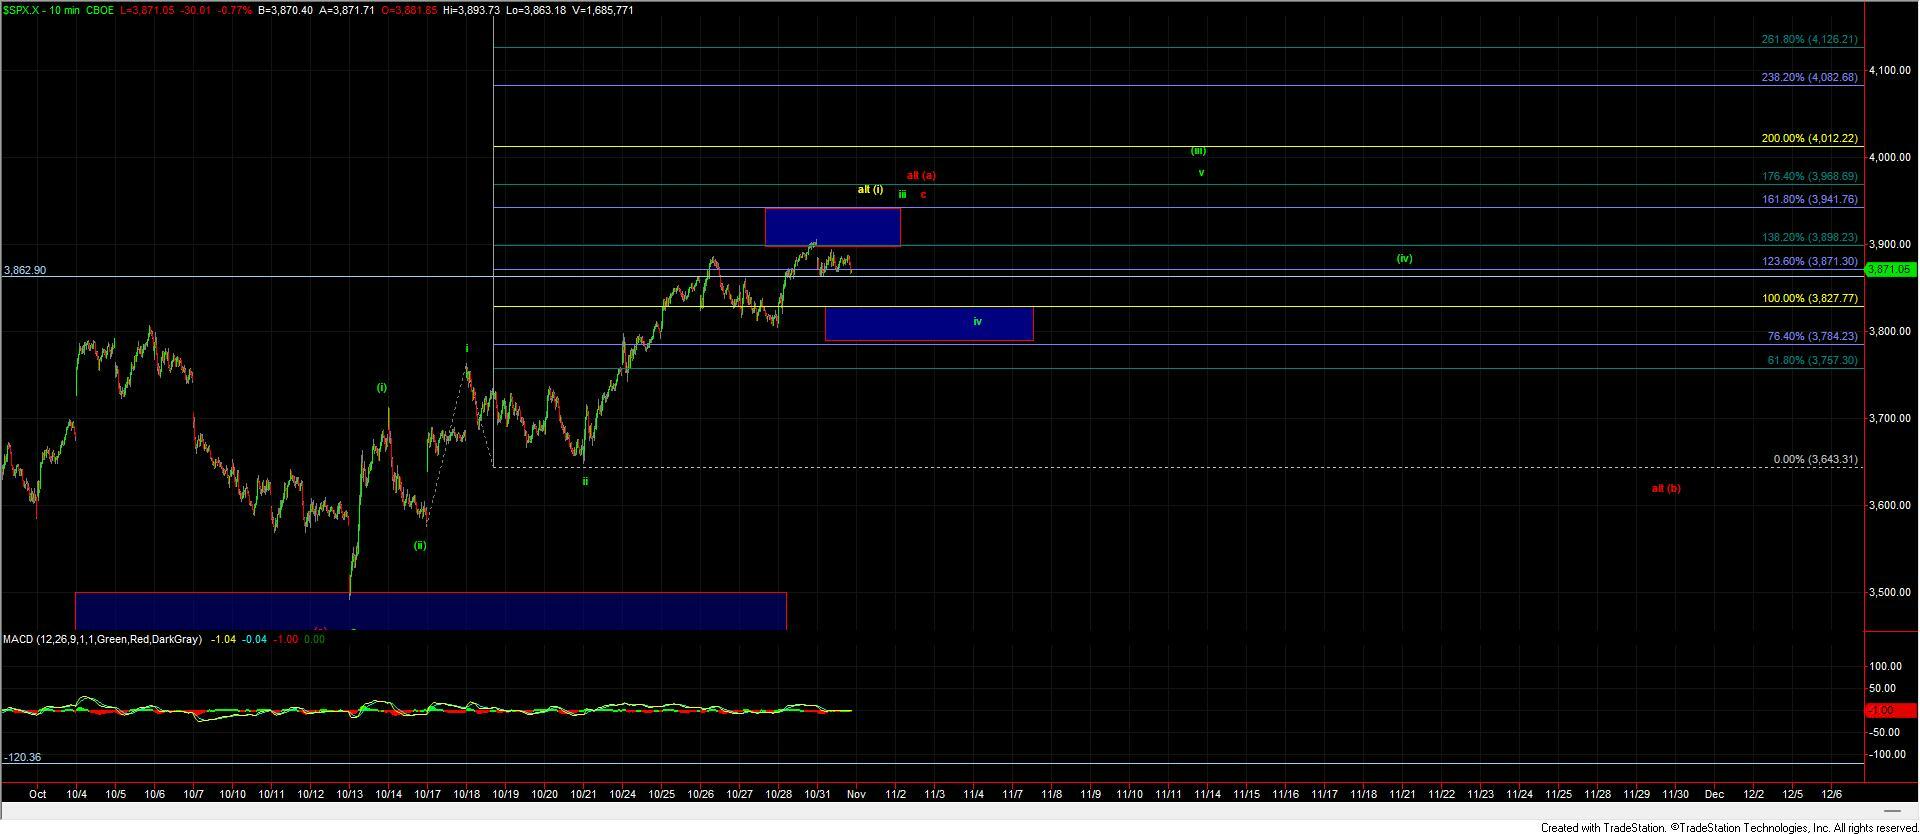
This morning we saw the market pullback and test the micro support zone which if broken would signal that we have begun the wave iv of (iii) as laid out on the SPX 10min chart. We did manage to hold the first test of that support this morning and push higher on what was a fairly sloppy three wave move only to be rejected at the 61.8 retrae level of the initial move down. Since that point in time, we have chopped around a bit more and as we approach the close we are once again trading near the lower end of that micro support zone which if broken would suggest that we have put in at least a local top in the green wave iii. Assuming that we do indeed break down below the micro support zone we will watch for this to hold support for the wave iv before pressing higher once again to give us a potential five up as laid out per the green path. Should we break below the support zone for the wave iv then it would open the door for this to be following one of the alternate paths as laid out on the charts and described below.
Green Count
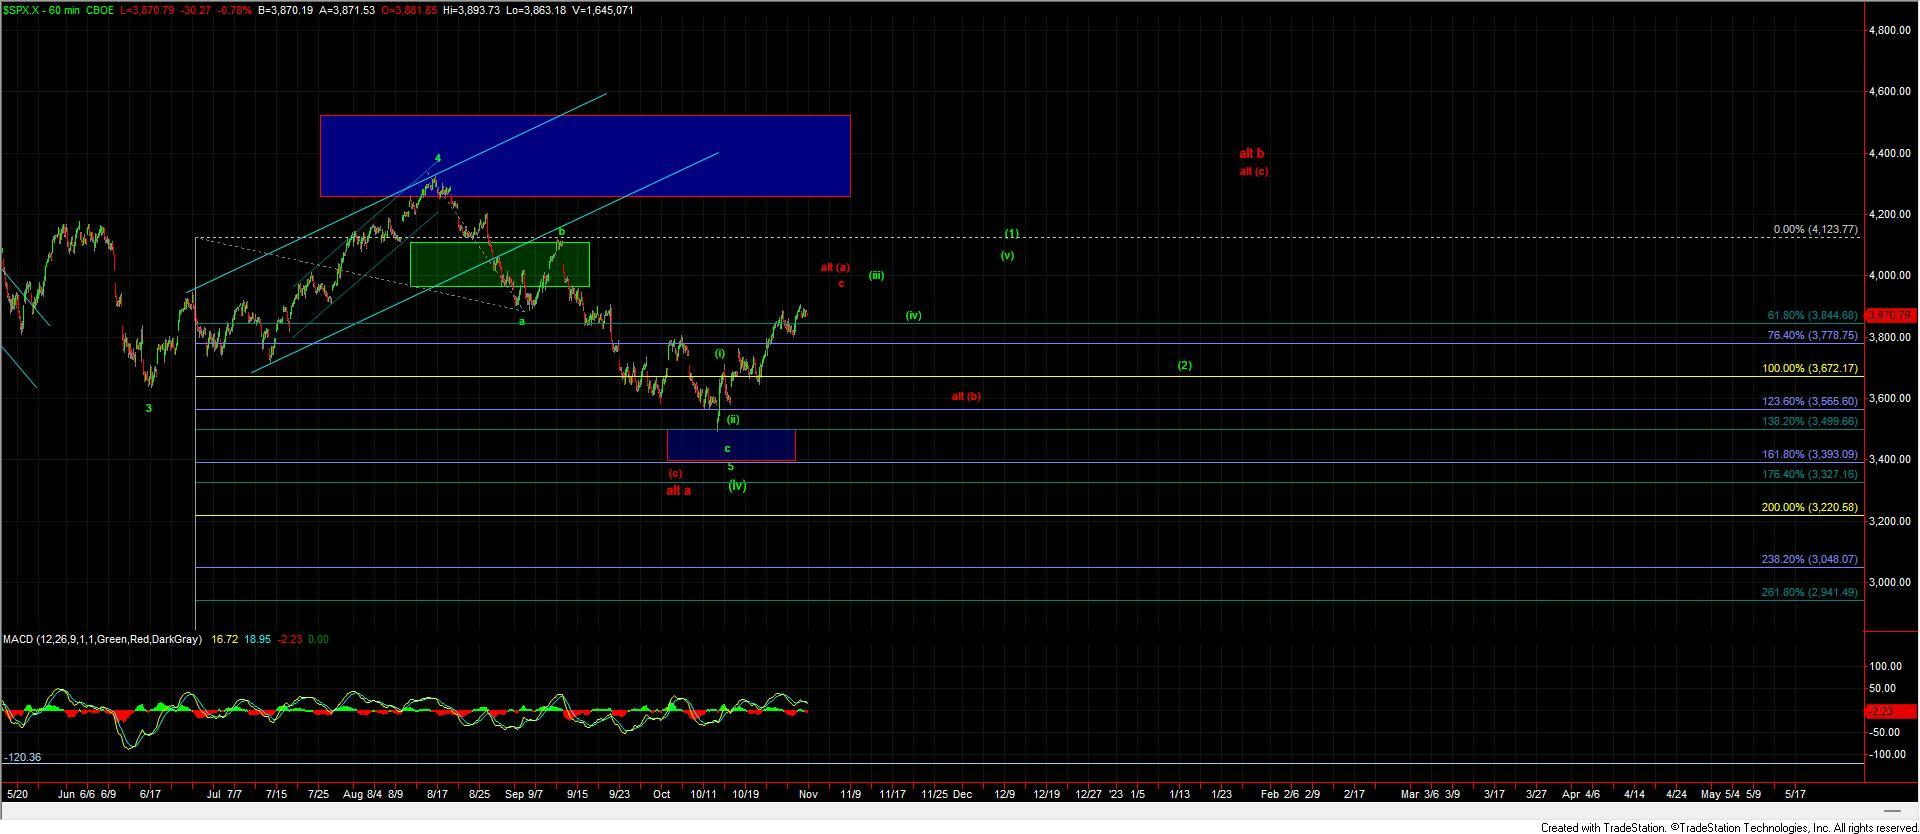
For this to hold the green count we will need to see this hold over the 3827-3784 zone for the wave iv. Now until we break under 3862 we do not have a signal that we have topped in the green wave iii just yet however the price action so far today is quite sloppy and I think that the only way for this to push higher without breaking down first would be for this to be forming a micro triangle. The proportions of this potential triangle are far from ideal however so I am hesitant to adopt this as a primary count however I will leave it on the board for now until we do in fact break the 3862 low. After bottoming in the wave iv we should then head higher to finish off the wave v of (iii) and then would still need one more (iv) and (v) to finish off the larger degree wave (1) off of the lows. From there the wave (2) retrace would give us the next larger degree buying opportunity but for now we still need to focus on holding the key support levels as laid out and fill out the possible five up off of the lows before getting too overly excited about that next big leg up.
Yellow Count
If we break down under the 3784 level then it is still possible to make the case for five up in the yellow count however this structure is far from ideal and I certainly would be quite cautious with this count until it is proven with a clear and clean wave i of (ii) upon a corrective retrace.
Red Count
Like the yellow count a break of 3784 would suggest we may have put in a larger degree top at which point we would be looking for a corrective retrace before pushing higher in a wave (c). That wave (c) however would likely not exceed the all-time highs but would rather set up another leg lower as part of the larger degree topping pattern that has been laid out in Avi's weekend update. For now however and as long as we can hold support we can still give the green count the benefit of the doubt but a break of support would give us an early signal that we may have indeed put in that larger degree top.
So overall not too much has changed today from what Avi has laid out in the weekend update. We are still in a bit of no-mans-land on the micro wave counts as we are under last week's high but still over support. The pattern however is still suggestive that whichever way we break the trading will become a bit more difficult in the next couple of weeks ahead. If we break up then we likely will be dealing with a series of fourths and fifths which are difficult to trade and if we break down we likely will be dealing with corrective price action for a wave (ii) or (b). Either scenario would suggest being patient in this region would be prudent.