Market Testing The Limit
 By
By
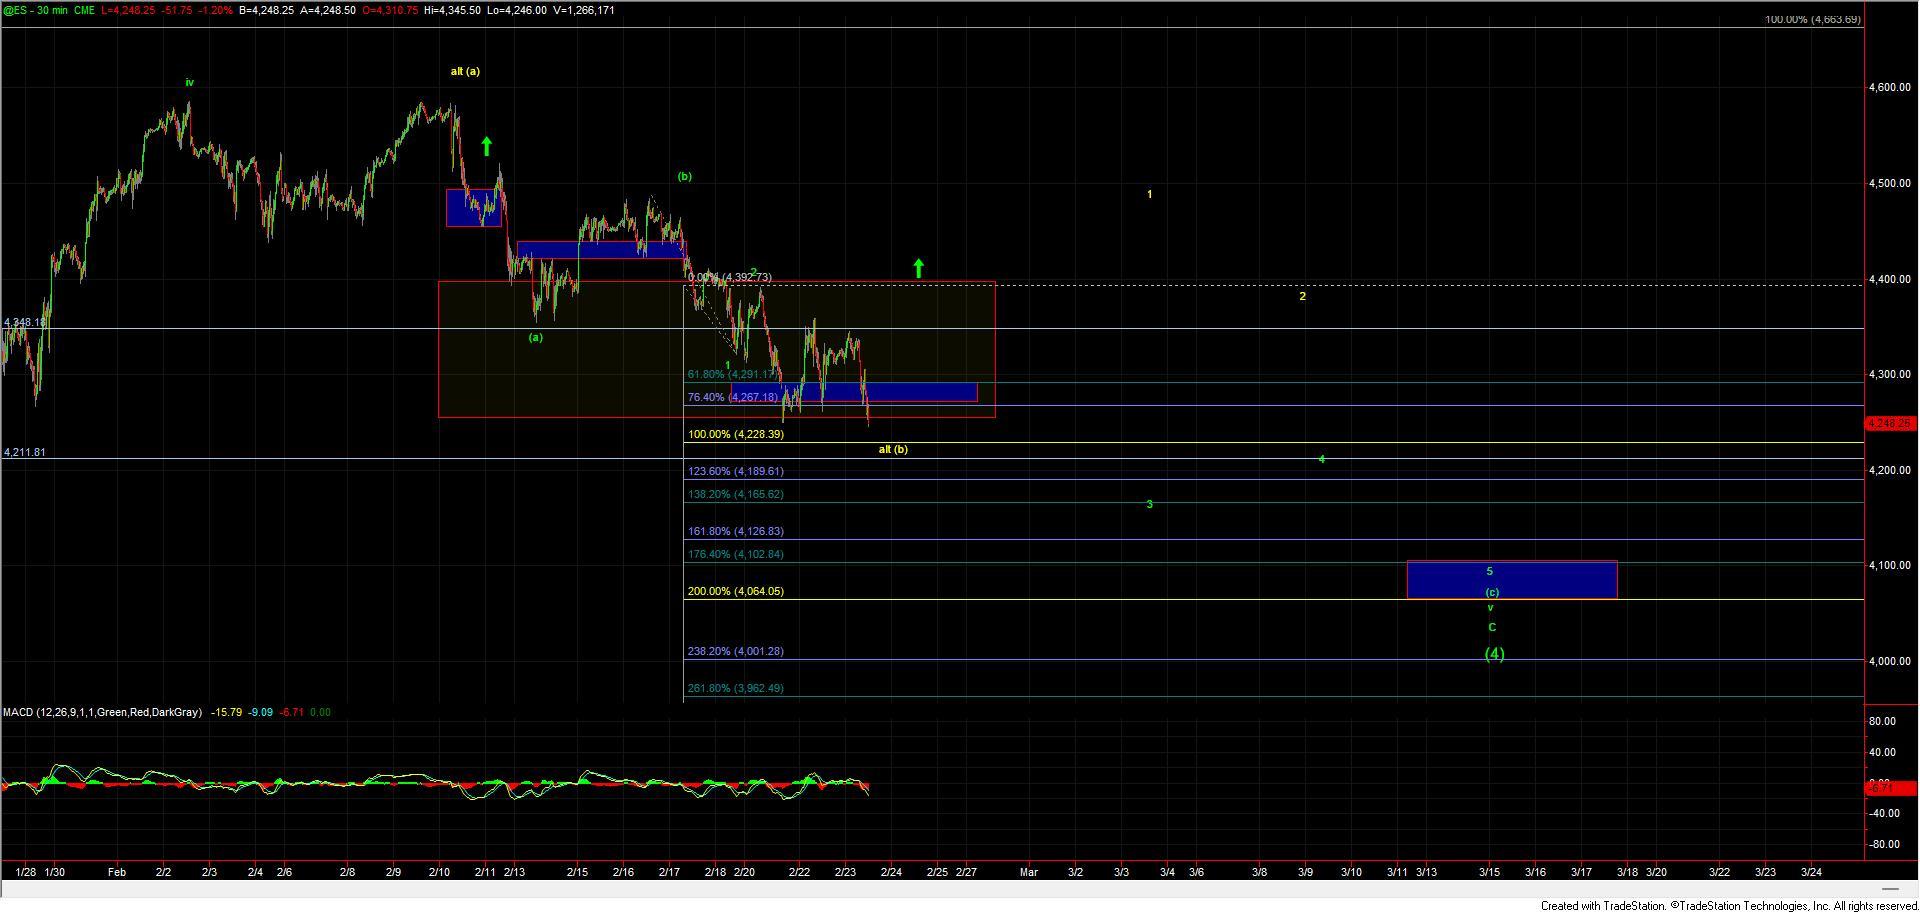
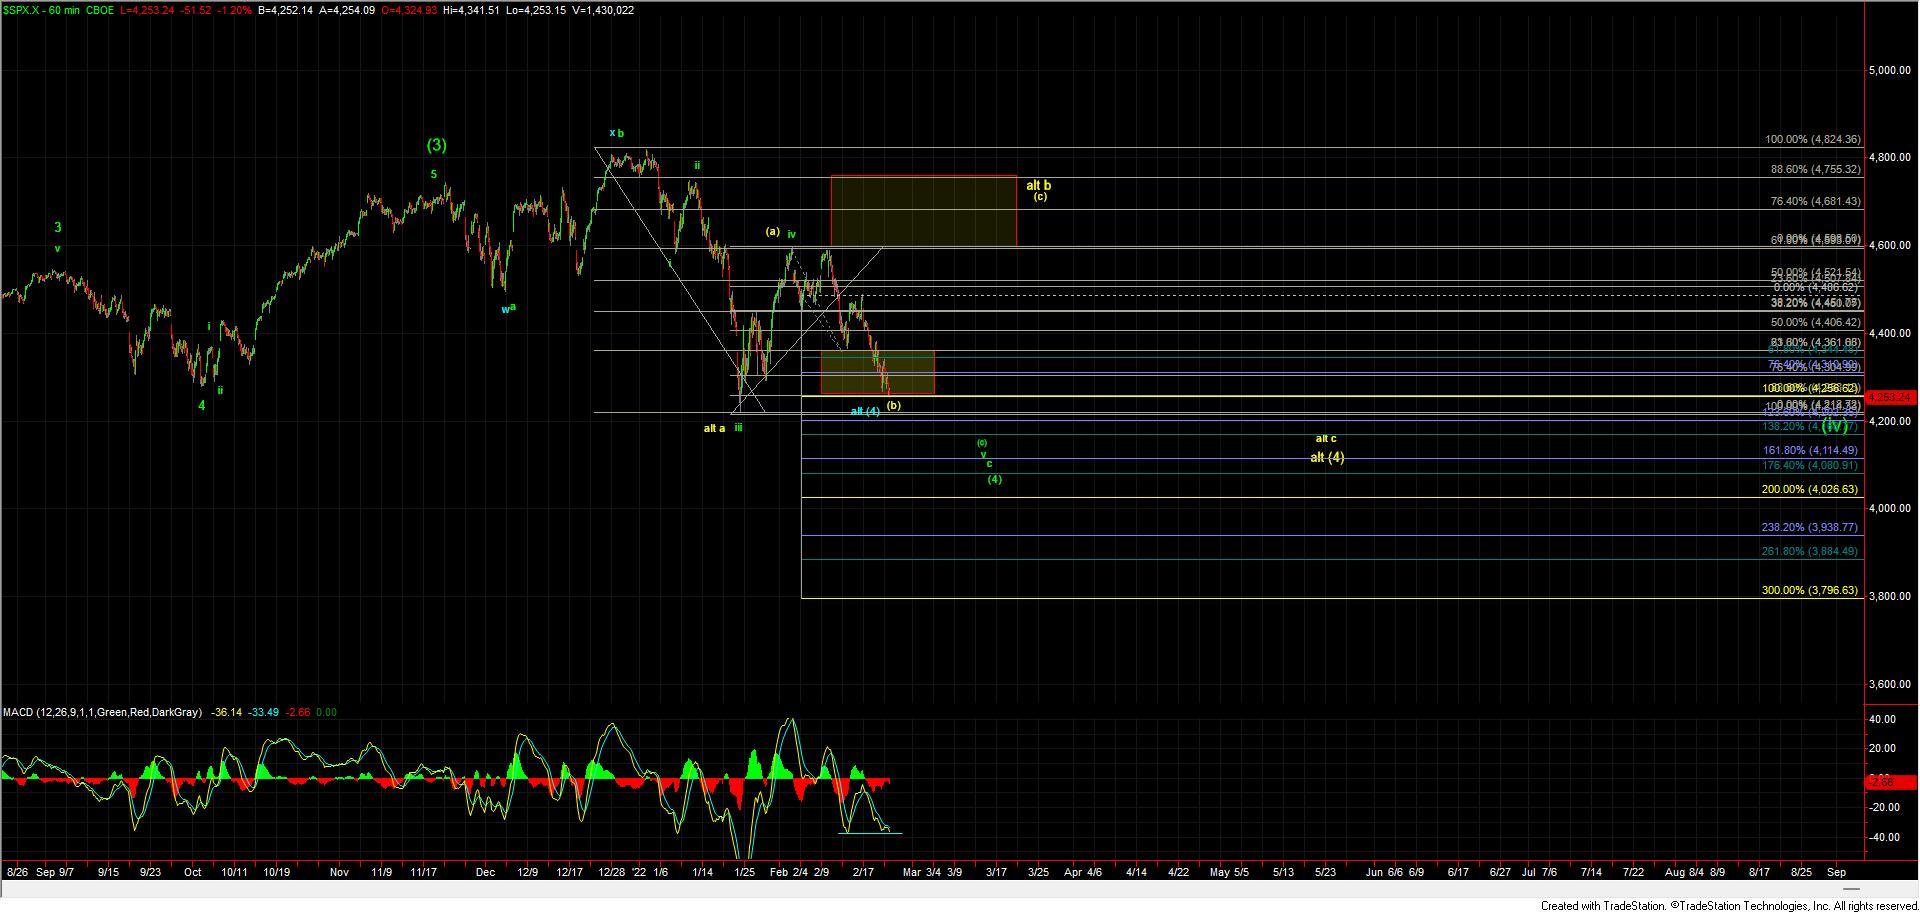
Today we saw the market continue to push lower thus keeping the green count suggesting that we will see another lower low before finding an ultimate bottom in the larger degree wave (4) very much intact. With that being said the SPX is still hovering over some very key support levels as shown on the 60min chart as we approach the final hours of trading thus also keeping the yellow count which is suggestive that the market sees at least a local bottom near current levels also intact. We are however nearing the limit of where the yellow count should hold to the downside so the market is going to need to make a decision here sooner rather than later to indicate which of these paths is going to play out.
The green count still remains the primary path for the time being as it is the cleanest way for this pattern to finish off the larger degree wave (4) under what are very oversold conditions. Under this count, we should see the market continue to break directly lower while holding under the 4348 level on the ES chart. The next key fib support and pivot below to confirm this green count comes in at the 4228 level and if that breaks it should open the door to see a fairly direct move down towards the 4165-4126 zone below for the wave 3 of (c) with the ultimate wave 5 of (c) targets closer to the 4102-4064 zone. This should then set up a final bottom in the larger degree wave (4) after which a push to new highs should be underway.
If we manage to hold near current levels and break back over the 4348 level on the ES and follow that up with a clear five wave move to the upside then it would open the door for this to have found a bottom in the yellow wave (b) under which case we would expect a wave (c) of a larger wave b to take hold over the next several weeks. The lower that we drop and should we break the 4228 level ES below the less likely this yellow count will become. For now however and as long as those levels hold we still have to allow for this path to remain intact.
Finally, we have the blue count which while quite ugly and not terribly common would allow for a possible bottom of all of the wave (4) to be in place. This count is more of an attempt to fit the possible SPX count with that of the possible already bottomed counts on the RTY and NQ which both have potentially cleaner and completed patterns in place. It would however be quite difficult to determine the difference between the blue and yellow counts in the early stages as they both should begin with a strong five-wave move to the upside. It wouldn't be until we near the upper resistance zone closer to the 4700 area that we would be better able to eliminate one over the other. For now, however, this blue count does remain an unreliable alternate but still technically valid nevertheless.
In summary, today's action is still allowing for both the yellow and green counts to remain intact but as we are nearing the limit we should have an answer sooner rather than later as to which path this is going to take.