Market Testing The Highs
 By
By
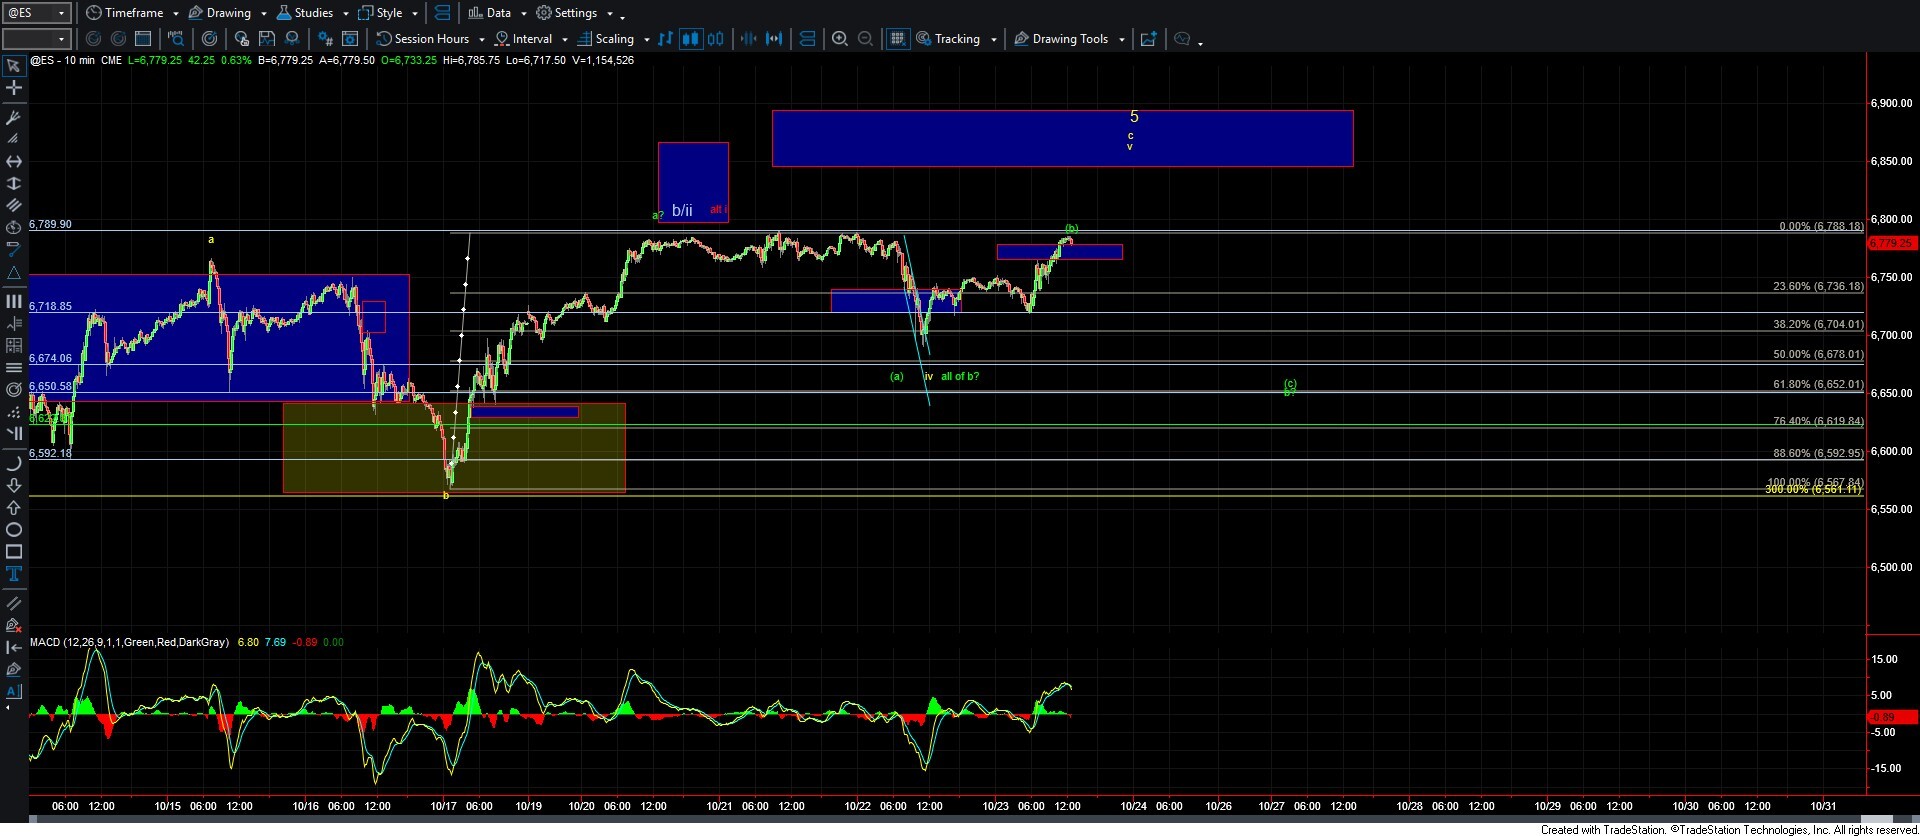
After moving lower yesterday, we saw the market push sharply higher today as we once again retest the highs. As we’ve been dealing with for several months now, the price action remains quite sloppy in this region, as we continue to see three-wave moves both to the downside and upside. This is typical when trading within Ending Diagonal (ED) patterns, which still appears to be the case as the market continues to grind higher.
On the smaller timeframes, I’m tracking a few different potential paths, all of which would likely ultimately lead to new highs. The bigger question at the moment is whether we’ll see a pullback before that next high is reached.
As shown on the ES chart, the green path suggests we may be topping in a wave (b) of a larger wave b as part of a larger Ending Diagonal to the upside. Under this scenario, I would expect to see a five-wave move lower back under yesterday’s low to complete that wave b. A break below the 6744 level would likely confirm the start of that next leg down, which should ultimately land somewhere in the 6678–6619 zone.
If we’re unable to break lower and instead make a direct push to new highs, it would open the door for this to have already bottomed in that wave b shown in green, or potentially be tracking a wave v of an ED off the 6567 low. There are some structural issues with this count, as wave iv would have been quite large relative to wave ii of the same degree. However, it’s still technically valid, and given the very sloppy price action, it remains a viable path forward at the moment.
For now, I’ll be focused on the 6567 level as the key downside pivot, and the previous high at 6789 as the upside pivot, to help determine which path the market is likely to follow. Of course, given the corrective and choppy nature of the recent moves, we should expect a few twists and turns in the days ahead and remain flexible as new developments unfold.