Market Testing Support - Market Analysis for Aug 20th, 2019
Yesterday afternoon, I tried to outline the perspective I was seeing in the smaller degree patterns we are tracking. As I noted, our expectation was for the market to imminently see a pullback to test the 2880-2900SPX region. And, today, that is exactly what we are doing.
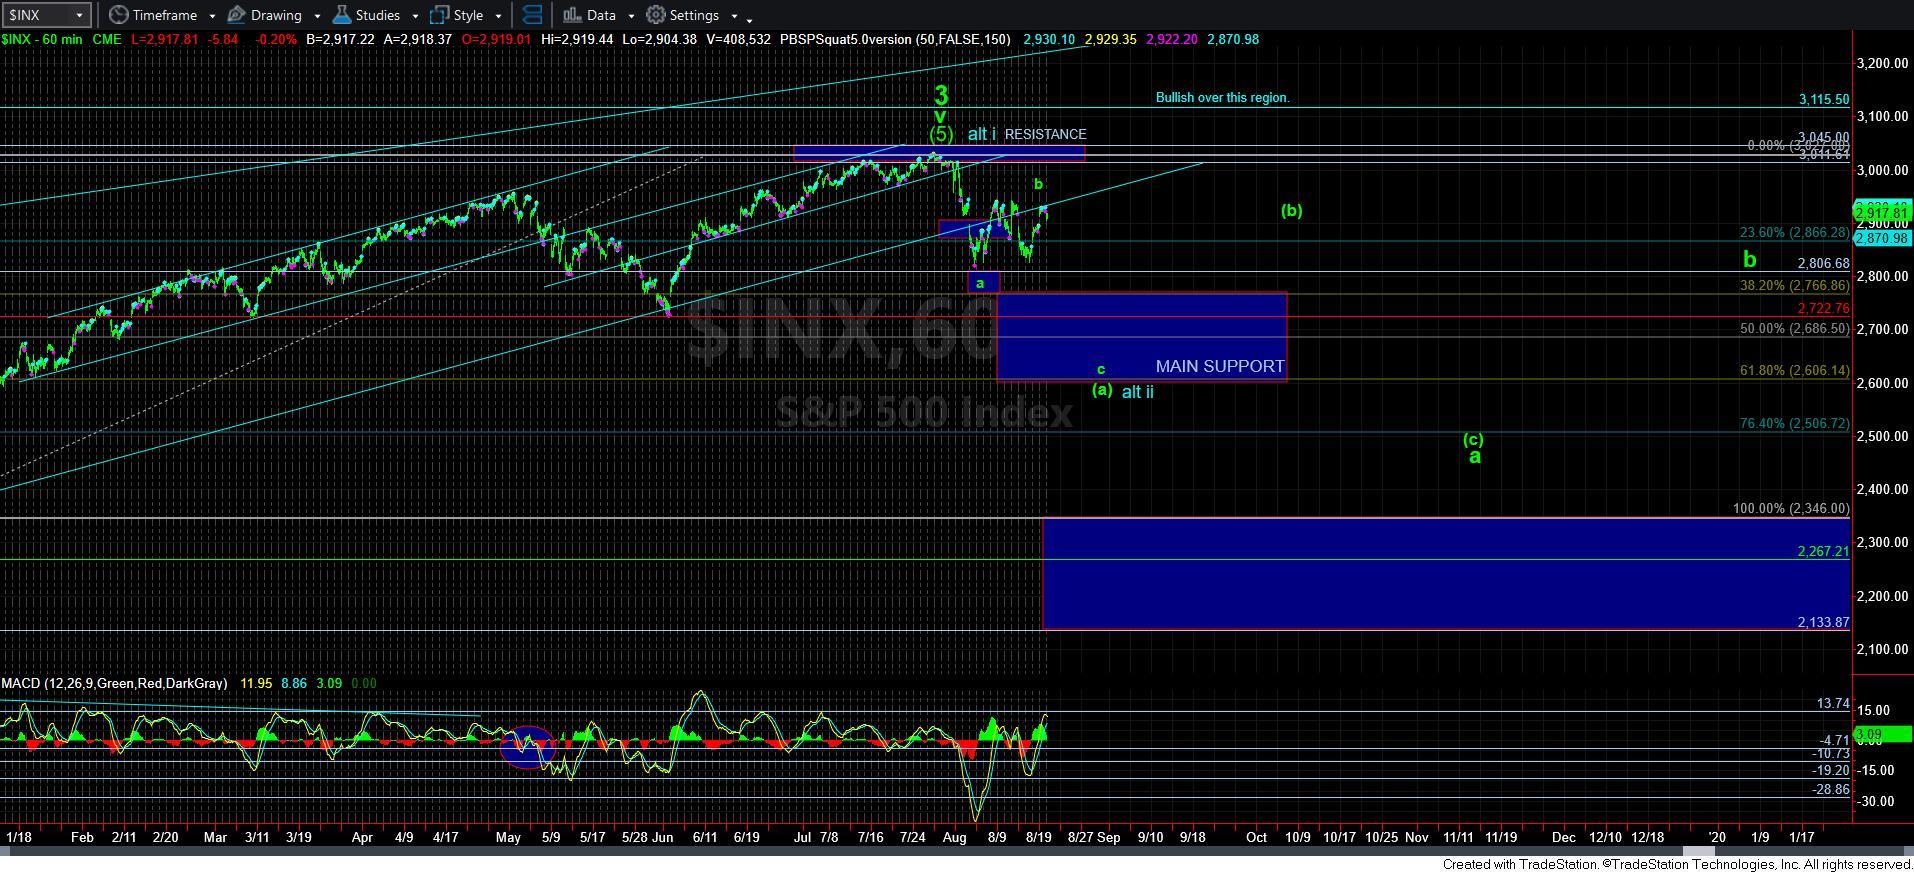
So, to refresh your recollection, as long as the 2880-2900SPX support holds, then we can expect a 5th wave to complete this [c] wave, which would also complete a much larger b-wave flat, which would likely set us up to drop down below 2700SPX in a c-wave decline.
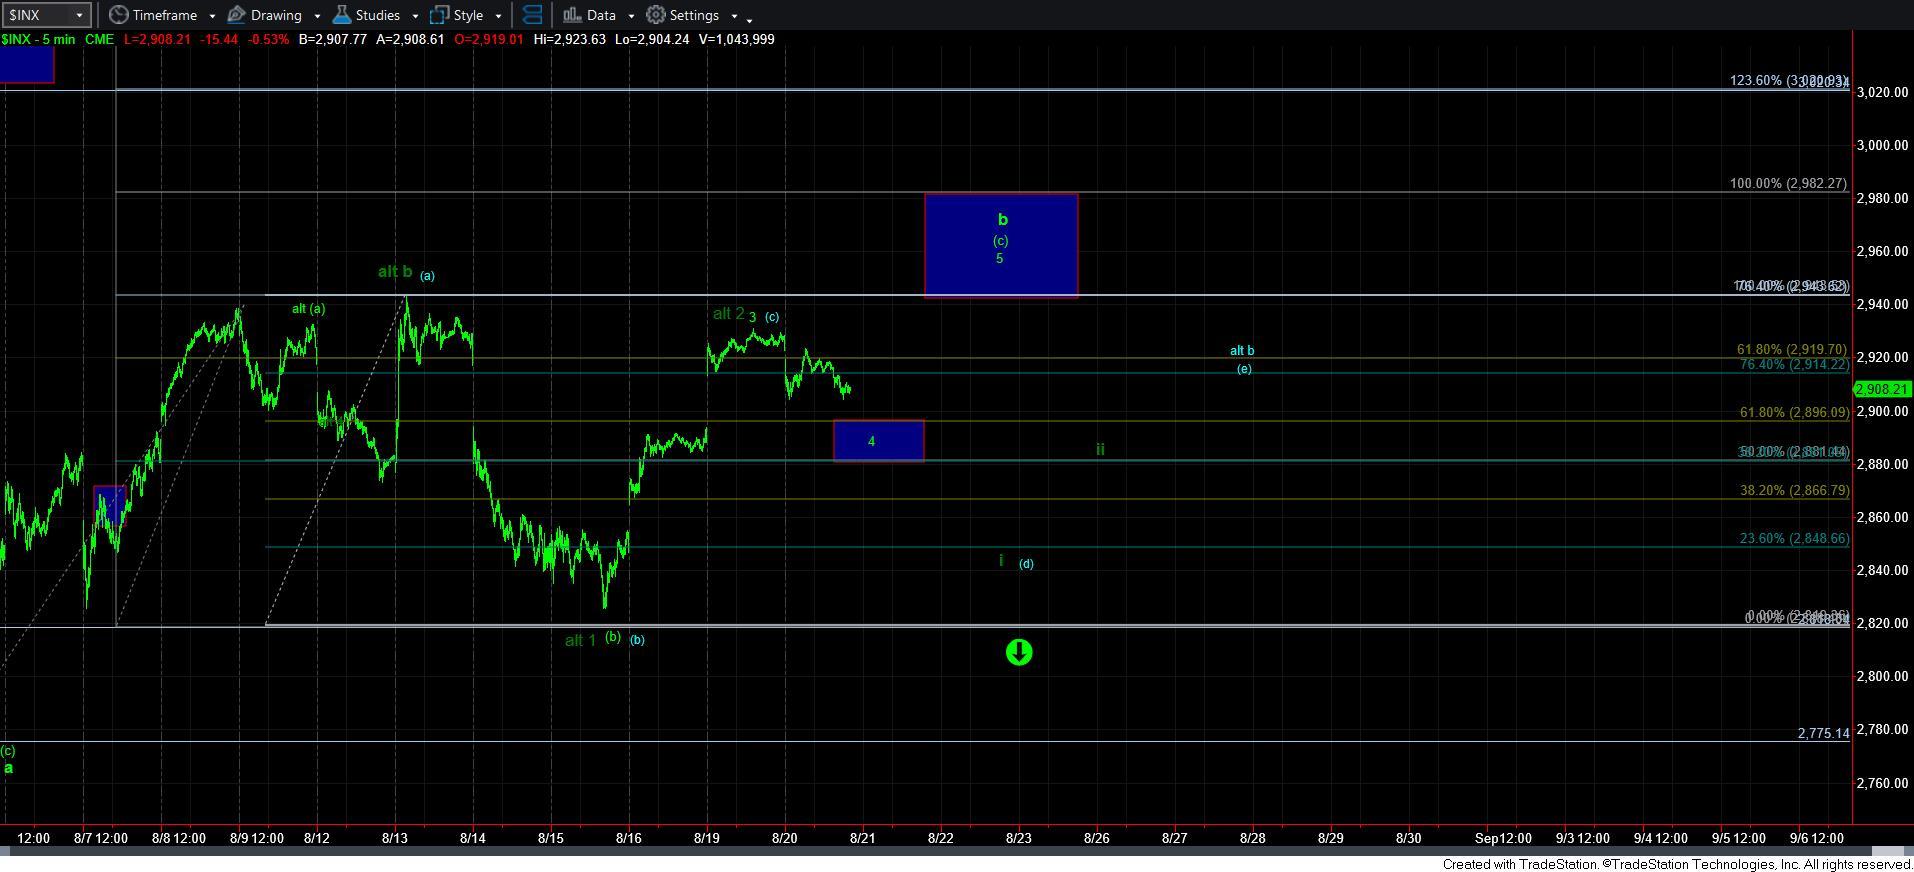
However, I noted that if we were unable to hold support, then either the 1-2, i-ii downside structure was developing (dark green count), or we would see a triangle for the b-wave develop (blue count). At this time, I am thinking that the triangle may be a higher probability should we break down based upon the overlap we have seen off the highs.
There is a point I made about the potential triangle earlier today that I want to repeat:
One fact I would like to cover about triangles here. At least one leg of a triangle is often complex. And, we see it most often in the c-wave. Since the c-wave of this potential triangle was not complex, it would lead to the assumption that the d-wave in this potential triangle would be complex.
So, based upon this knowledge, if the market goes down fast and hard, it makes it likely that it is wave i of 3 down. However, if we see a lot of chop, then it makes it more likely we are in a triangle.
So, if the market does begin to decline below support in the current structure, it would have me leaning towards the [d] wave of the b-wave triangle in the blue count, especially if it continues to maintain a complex structure.
In conclusion, nothing much has changed, as they market has been following our expectations. As long as the 2880-2900SPX support holds, I am looking for a 5th wave rally to our target box above. Should we break support, then I am leaning toward the triangle count presented in blue, which would complete the b-wave, and set us up for the c-wave decline we expect to take us below 2700SPX in the coming weeks.
But, the commonality between the counts resolves around 2880 support. If we break 2880SPX, then the high for the b-wave is likely in place. That is what we have to focus upon.