Market Testing Lower End Of Support
 By
By
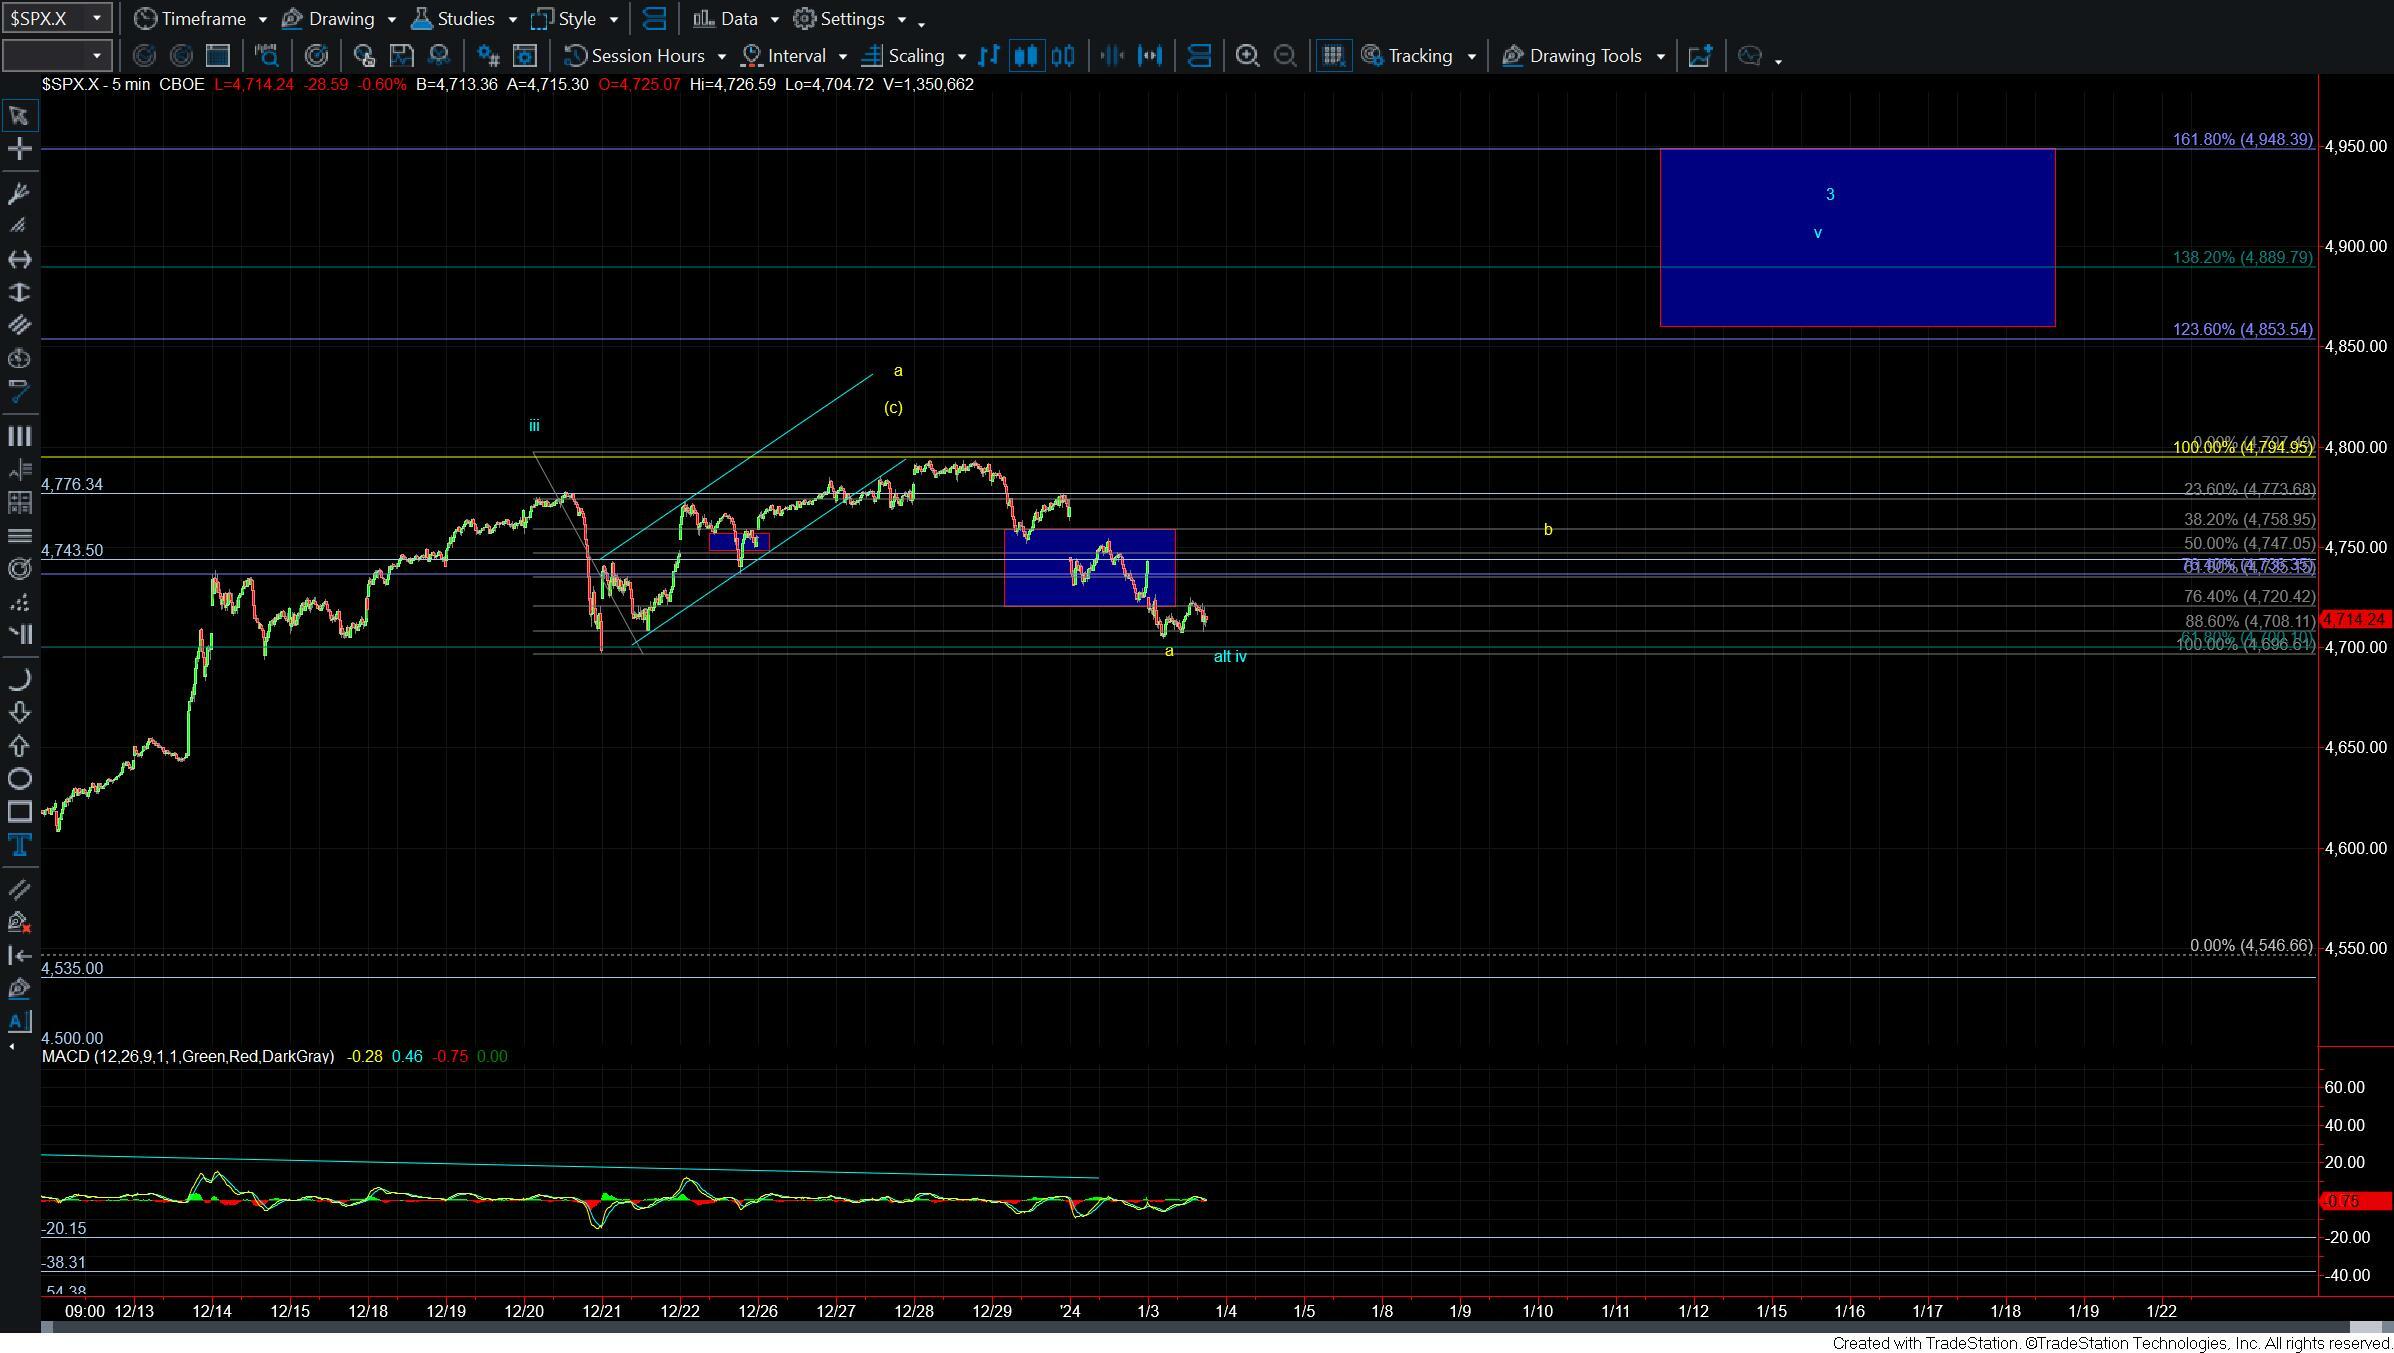
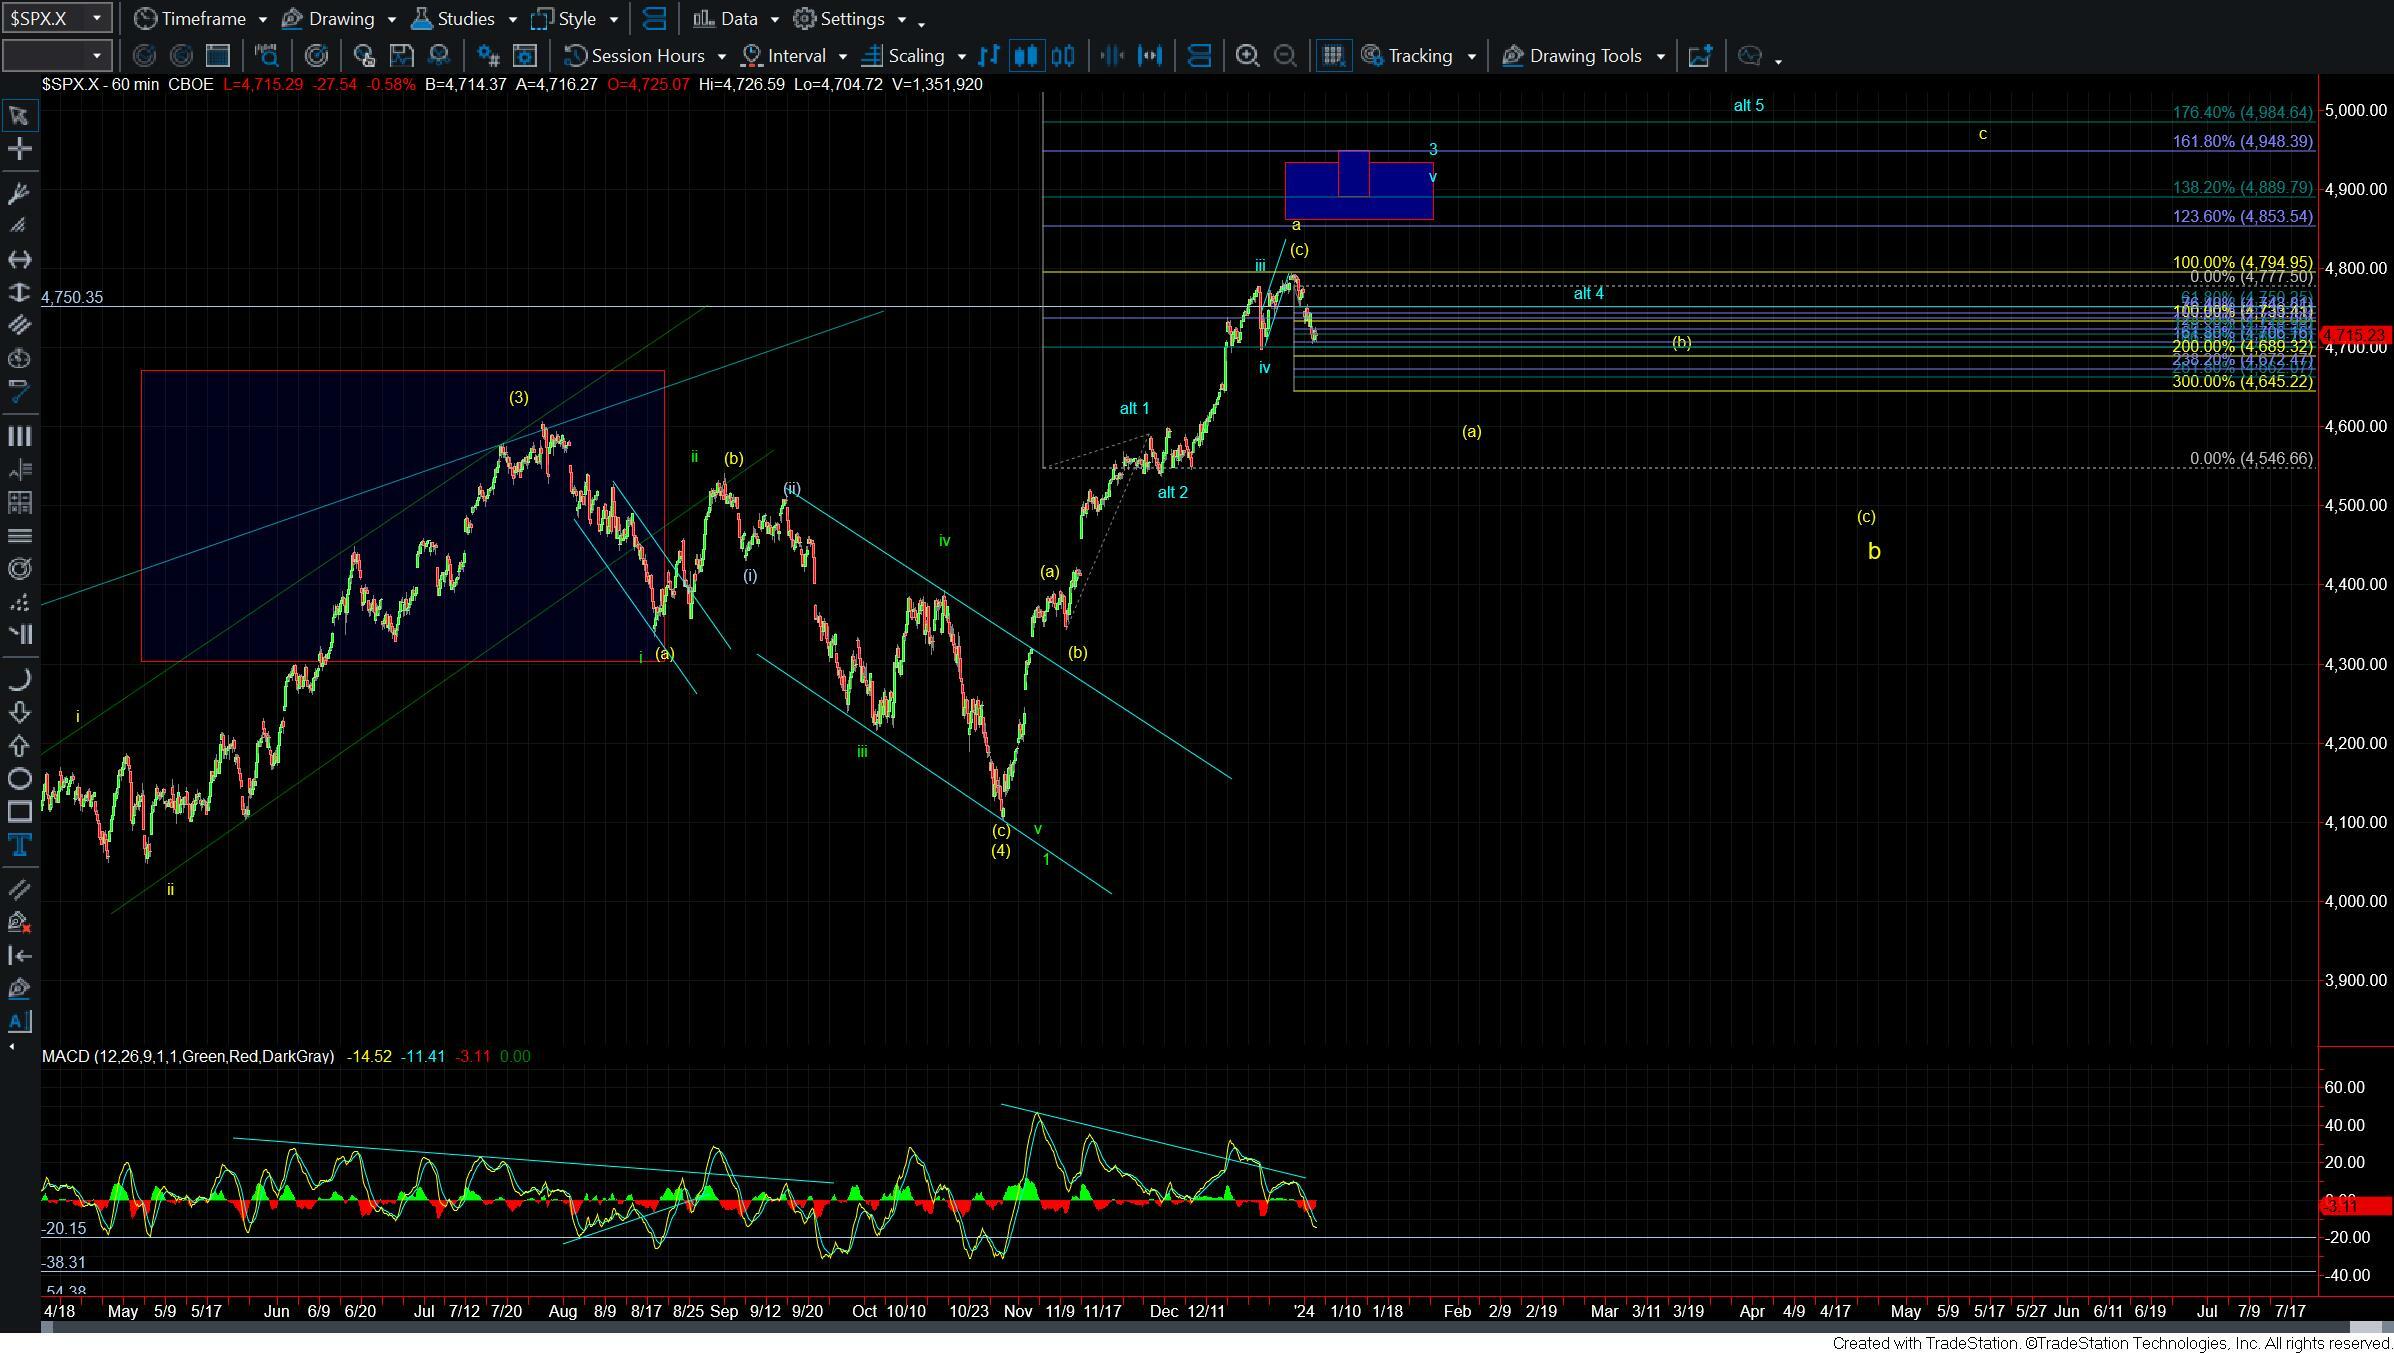
Today we continued to move lower and have broken the upper end of the support for the potential wave (ii) that we had shown in the blue count. We have not officially invalidated the blue count as we have yet to break the 4896 low however with this deep retrace it is making it much more probable that we are indeed following the yellow count.
Even though I am leaning towards the yellow count at this point in time I still think we should see a corrective retrace from around these levels before seeing a direct break lower. Just keep in mind that with this move down and as long as the retracement higher comes in a corrective fashion the near-term pressure will remain down.
Zooming into the shorter timeframes I think this retrace is a bit too deep to reasonably still be a wave (ii) as previously shown. So with that, I am going to adopt this as a potential wave iv bottom as shown in blue. This is still an alternate path and at this point in time my primary count is that we are following the yellow count. This will remain the case as long as we move up in a corrective fashion and hold under the 4794 high.
As noted above I am leaning towards seeing a retrace higher as part of the wave b as shown in yellow before moving directly lower in the larger wave c of b. We do however need to get back up over the 4743 level to give us confirmation that we have indeed struck a bottom in that wave a.
Bigger picture not too much has changed and I am still leaning towards seeing higher levels later in the year but with the drop down today it is looking like we are likely going to see a deeper retrace per that yellow count before those higher levels are seen.
So while we still have yet to confirm the yellow count we are getting very close and I think we should have final confirmation in the next few trading sessions as the market continues this local topping process. Of course we have our parameters in place in the event that the market has other ideas and does continue to push higher per the alternate path as laid out on the charts.