Market Testing Its Limits
Based upon the evening update I posted after the close, the market has now retraced quiet deeply back up towards yesterday’s high, as per my expectations yesterday. So, the question is what the market does right here and now?
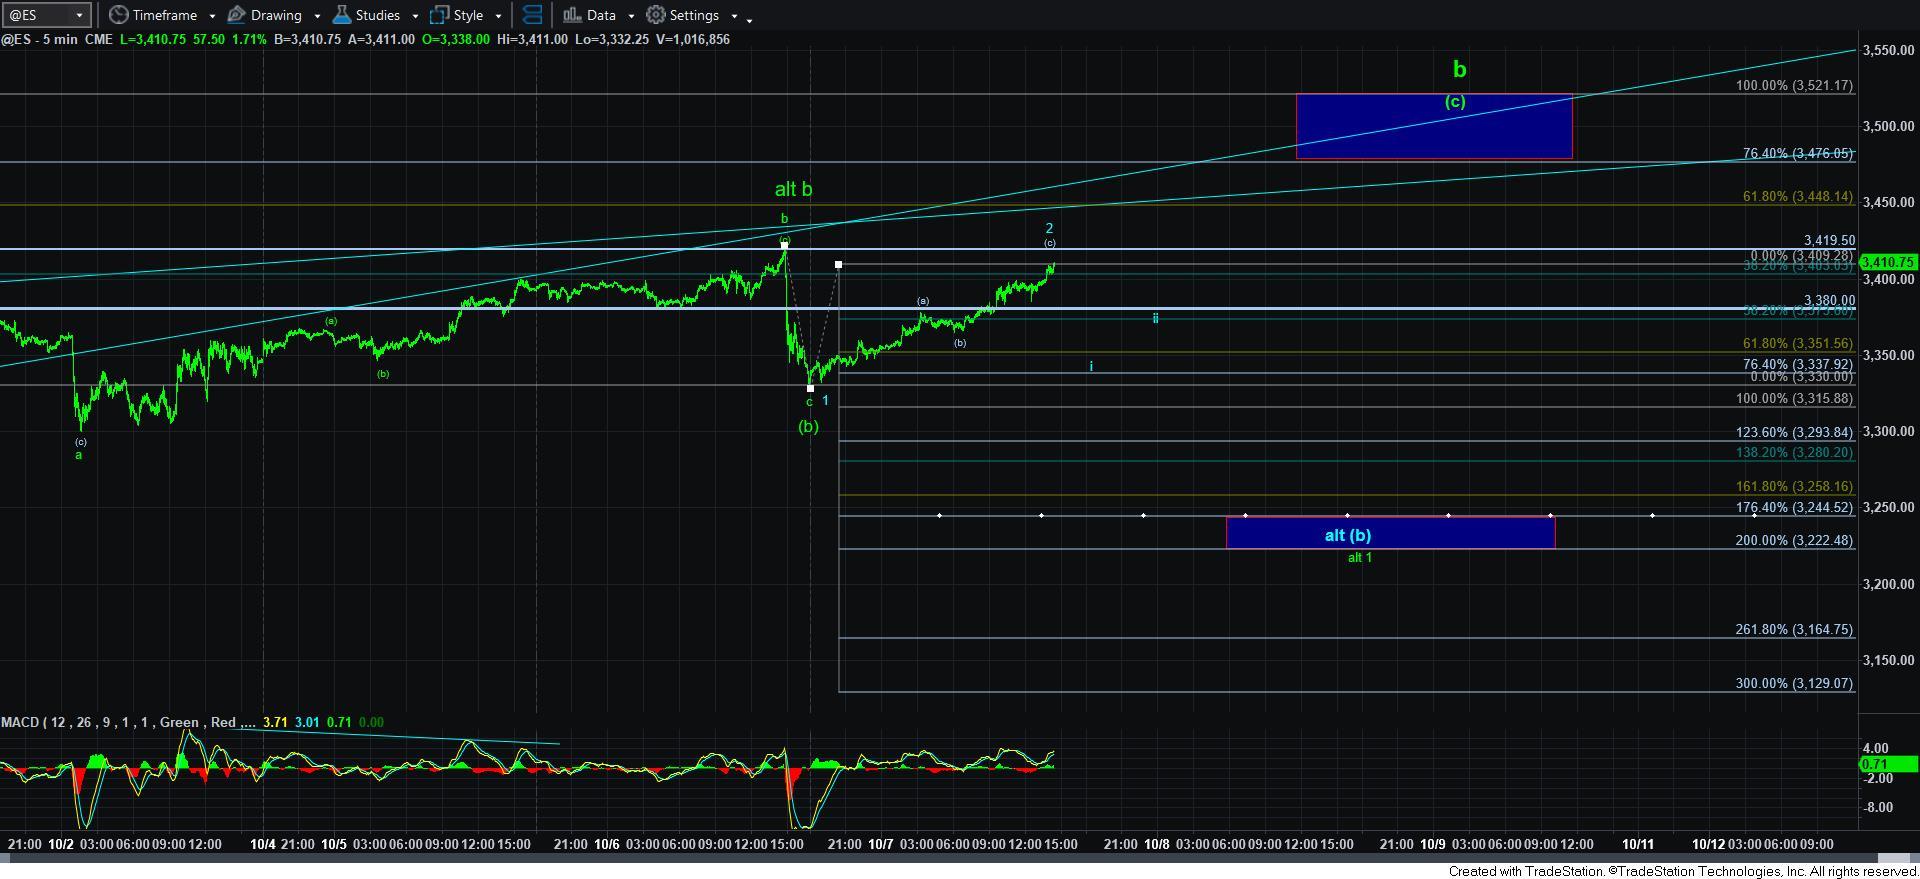
As long as the market holds below the high struck yesterday, we have a reasonable 1-2 downside structure pointing us to a deeper [b] wave, as highlighted in blue on the 5-minute ES chart. And, while I initially said that the 3250SPX level should hold on a deeper [b] wave, this could take us slightly below that, with a 2.00 projection as low as the 3230SPX region. If we do see this decline in the coming days, then my primary count would be that this is a larger [b] wave within the green wave count, with a [c] wave rally still to take us back up to he 3450-3500SPX region in the coming weeks.
However, if the market moves over yesterday’s high – even by one point – then it invalidates this specific downside set up, and would suggest we are heading to the b-wave blue box overhead in a more direct fashion. This would suggest that the decline yesterday was a c-wave in a running [b] wave, as I explained yesterday.
So, I am still trying to maintain an expectation for the market to see higher in this b-wave rally, but the specific path is still not wholly clear. But, as I have warned many times over, this is they type of action we usually have to expect in b-waves, as they provide many twists and turns, some of which we simply are unable to outline beforehand. This is why I have often compared trying to track a specific path in a b-wave to throwing jello for distance. Enjoy your jello this evening.