Market Testing Another Danger Zone
 By
By
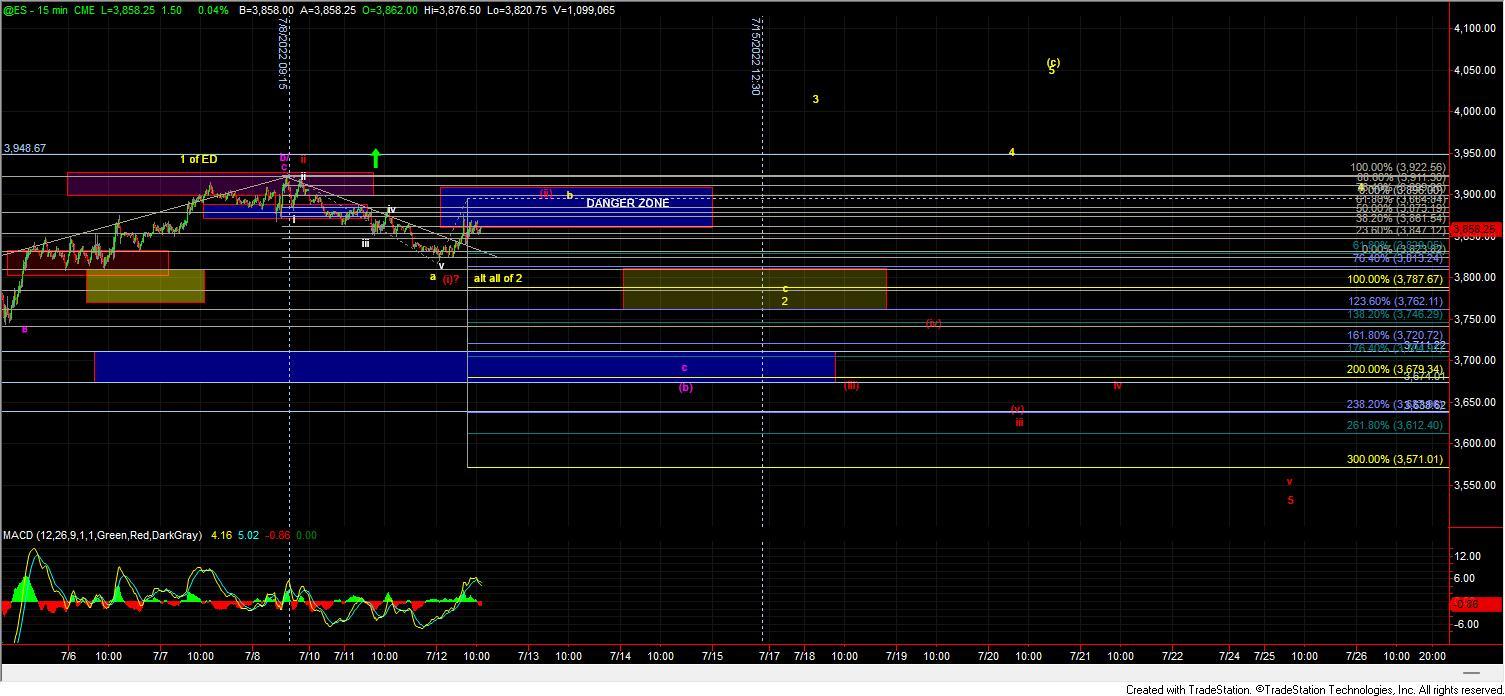
Overnight the market moved lower completing a potential five wave move to the downside off of the 3922 high. This morning we saw a corrective retrace higher into the lower end of the standard resistance zone for that potential five wave move to the downside. So with a potential five wave impulse to the downside followed by a corrective move to the upside we now have a setup which is pointing lower and that setup will remain in place as long as we do not push through the resistance zone that is shown on the ES chart at the 3861-3911 region and labeled as "Danger Zone" Now what I will note is that it is certainly possible that this resistance zone may only be a wave b of a larger wave 2 per the yellow count. That being said the five wave move followed by a corrective three-up does also leave the door very much open to seeing a strong push lower per the red count which would take this back under the 3638 low and ultimately target the 3498-3368 zone below.
Finally, this five down and three up also could still be part of the purple count but under that case it would project very deep into the 3712-3674 support zone below. So while the potential five wave move to the downside is giving us a higher probability that we will see at least another lower low under the overnight low all three of the paths that I have been laying out over the past several days are still very much intact here and it will still take at least into tomorrow and possibly into the end of the week before we are able to eliminate any of them. Furthermore, as long as the market is trading in the current "Danger Zone" I still remain cautious as this is currently set up to give us at least another push under the overnight low with the potential for this to reach quite a bit deeper before finding a bottom.
Yellow Count
I am still counting this as being in part of an ending diagonal up off of the lows to finish off the wave (c). Under this path I would be looking for a wave 2 to retrace down towards the 3832-3784 zone before turning back higher in wave 3 of c which should then be followed by a fairy deep wave 4 and then another push back higher for a wave 5. As I noted above I think it's most likley that we will still see another wave c of 2 lower before moving higher under this case. If we can get through the 3911 level overhead it would give us an initial signal that we may have bottomed in all of the wave 2 but as long as that zone holds I think its more likely that we will see another lower low even under this case. Support for this wave 2 remains in the 3831-3784 zone but if we continue to move lower and break the 3784 level then we likely are heading lower in either the purple or red paths.
Red Count
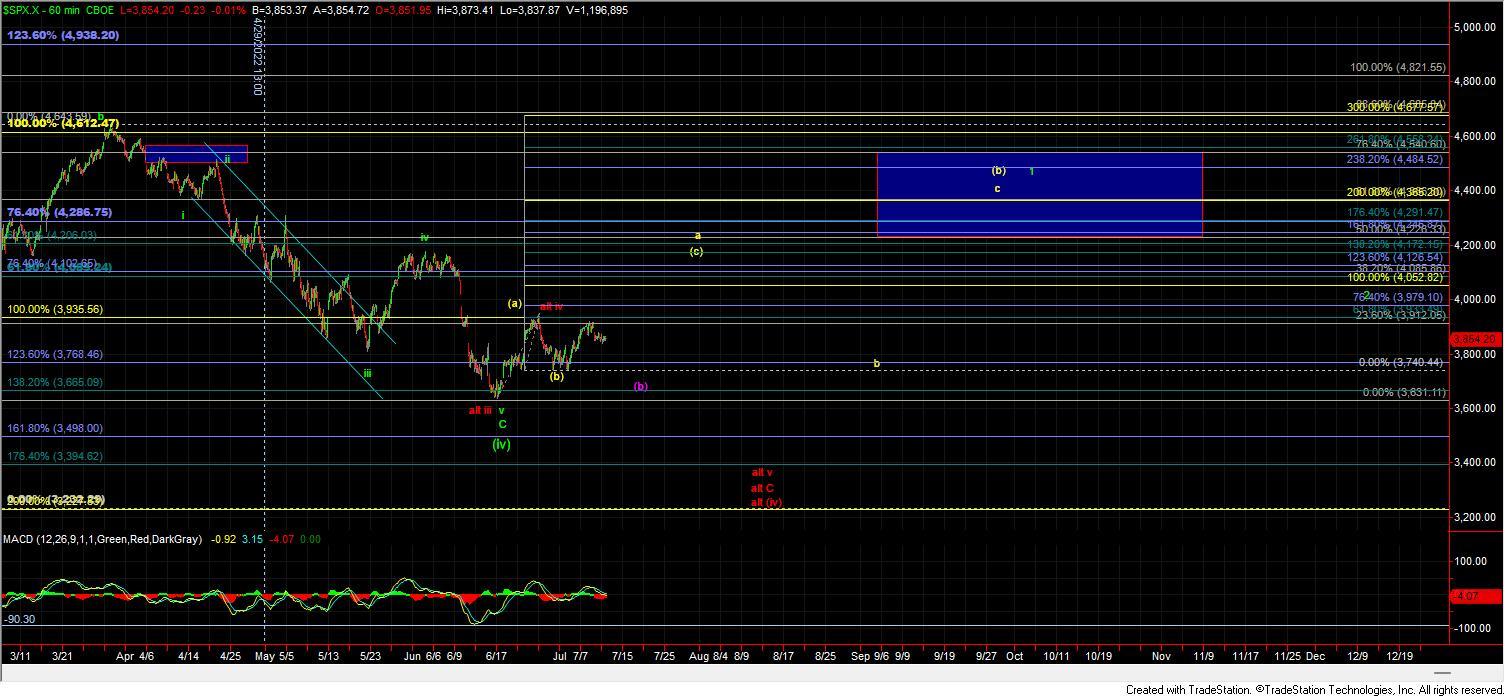
The red count looks like it finishing its wave (i) overnight with the larger i-ii following a very similar path to the purple wave b top. The red count would project back down to new lows under the 3638 level whereas the purple count would hold those levels before turning higher once again. If we do break down below that 3638 level per this red count then we still would be projecting down towards the 3498-3368 zone below and with what I can count as a five wave move to the downside the door is now open to this path.
Purple Count
Under the purple count instead of making a new lower low towards the 3500-3450 zone we would likey hold the 3712-3674 zone and bottom in a larger wave (b) before heading higher. This path would be following the same (i)-(ii) setup to the downside as the red path for the wave c of (b) down but again should stop short of making a new lower low under the 3638 level. As noted above this path would start out very similarly to the larger red i-ii but again would not make a lower low and turn higher before breaking the 3639 lows. As I noted before this may be the most painful path for both bulls and bears so it is one that I am still keeping a very close eye on.
So today's action has not eliminated any of the above counts however we do have some fairly clear parameters to work with but the bottom line is that until this can get through the overhead resistance zone at the 3881-3911 region the near-term pressure will remain down.