Market Tested The Bulls Today
As I highlighted in last night’s update, the 2730SPX region is going to be our indication that a potential high has been struck. And, today, the market came right up to that line, and turned back up rather strongly.
Overall, the additional update I provided this morning is still quite applicable, but with some minor variations, which I will now present. But, the main point is that as long as we hold over today’s low, the FOMO count is still quite applicable.
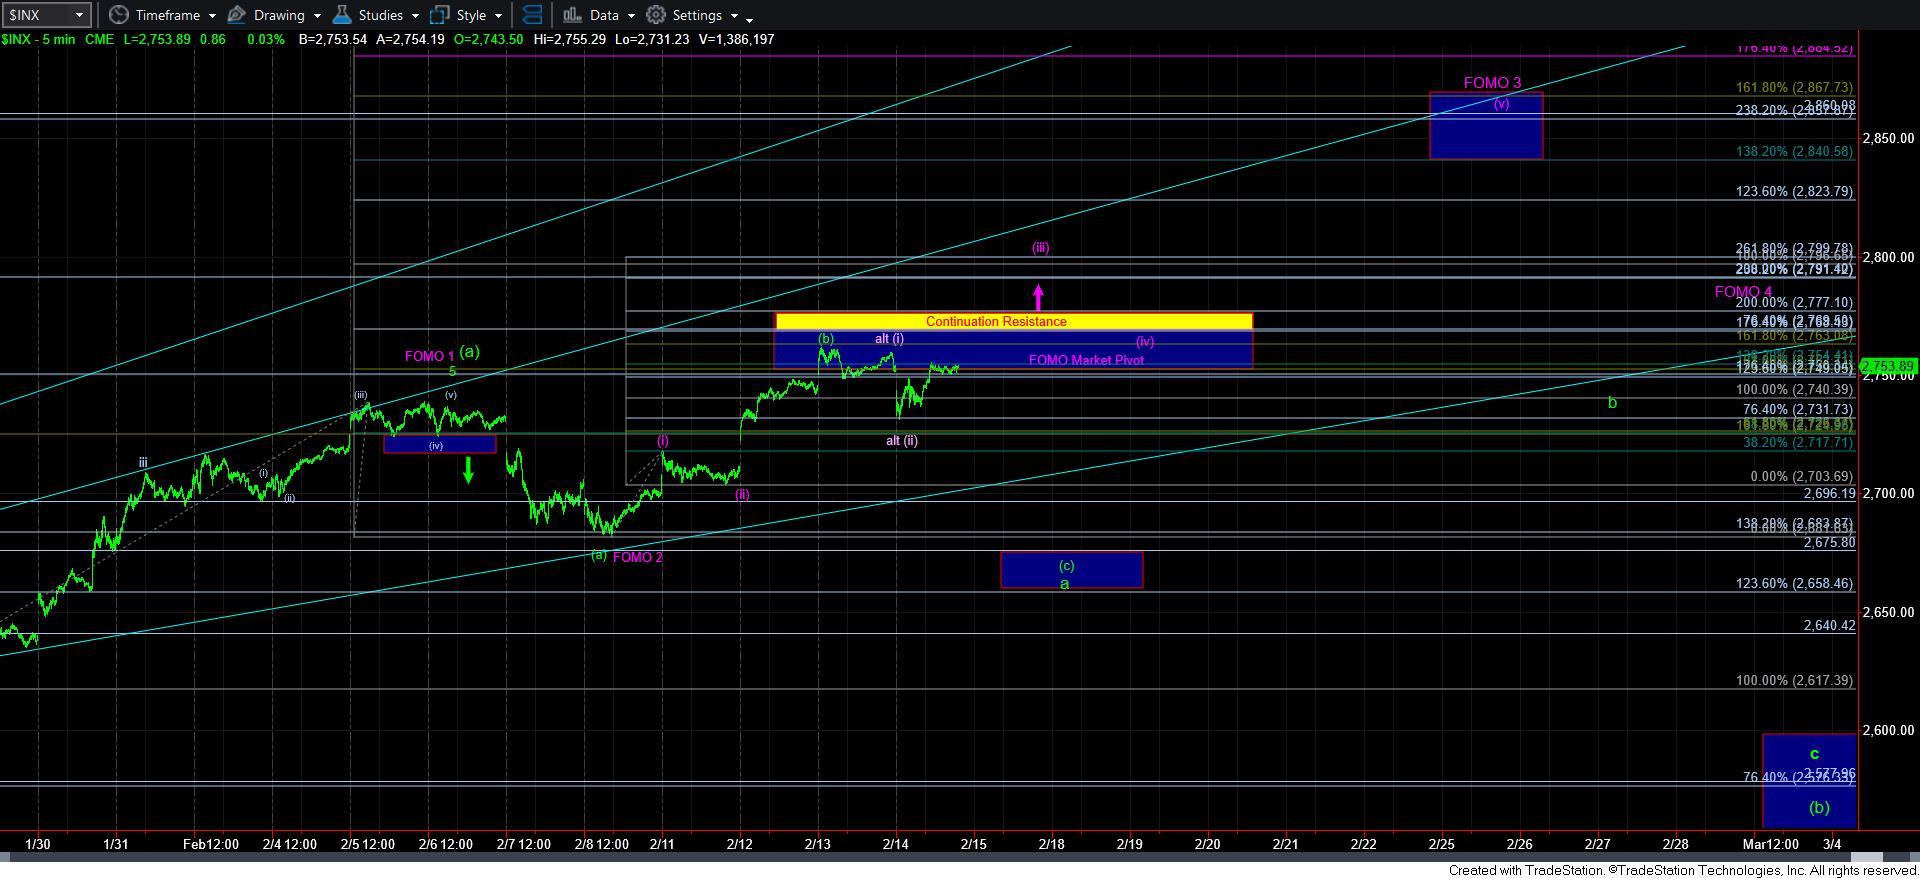
We are now approaching our next inflection point for the market in the 2770-77SPX region and the nature of the current micro structure is becoming a bit more complex. I will provide the detailed analysis, but will try to summarize the overall perspective once I am completed with the detail.
With the 2730SPX region holding as support thus far, we are now heading up in what can be a 5th wave off the low from last week. Clear resistance is 2770-77. That can also represent an even more extended [a] wave in green, which has been outlined by some of the other analysts.
Alternatively, we can even count a [i][ii] structure as presented in a more immediate bullish variation of the FOMO count, which is presented in pink. So, the nature of the current micro structure is starting to provide a lot more complexity.
Within Fib Pinball, wave [i] of 3 will often target the .618 extension of waves 1 and 2. However, in our case, in order to view wave [i] as having topped out at the region of the .618 extension, as presented in pink, we would need to rely upon a truncated top – which is never a highly reliable structure. But, it is one I will have to track for now.
Moreover, wave (iii) of 3 should target AT LEAST the 1.00 extension of waves 1 and 2, with the potential to extend as high as the 1.236 extension.
Additionally, the region between the .618 extension and the .764 extension is a market pivot within our Fibonacci Pinball structure, because once we break out through it on our way to the 1.00 extension for wave [iii] of 3, wave [iv] of 3 should hold that pivot support, and then continue higher to the 1.618 extension overhead for wave [v] of 3.
Therefore, when we put all these factors together, if the market is going to prove the FOMO count in the easiest fashion, we should be blowing through the 2770-77SPX region, and head directly to at least the 1.00 extension in the 2800SPX region.
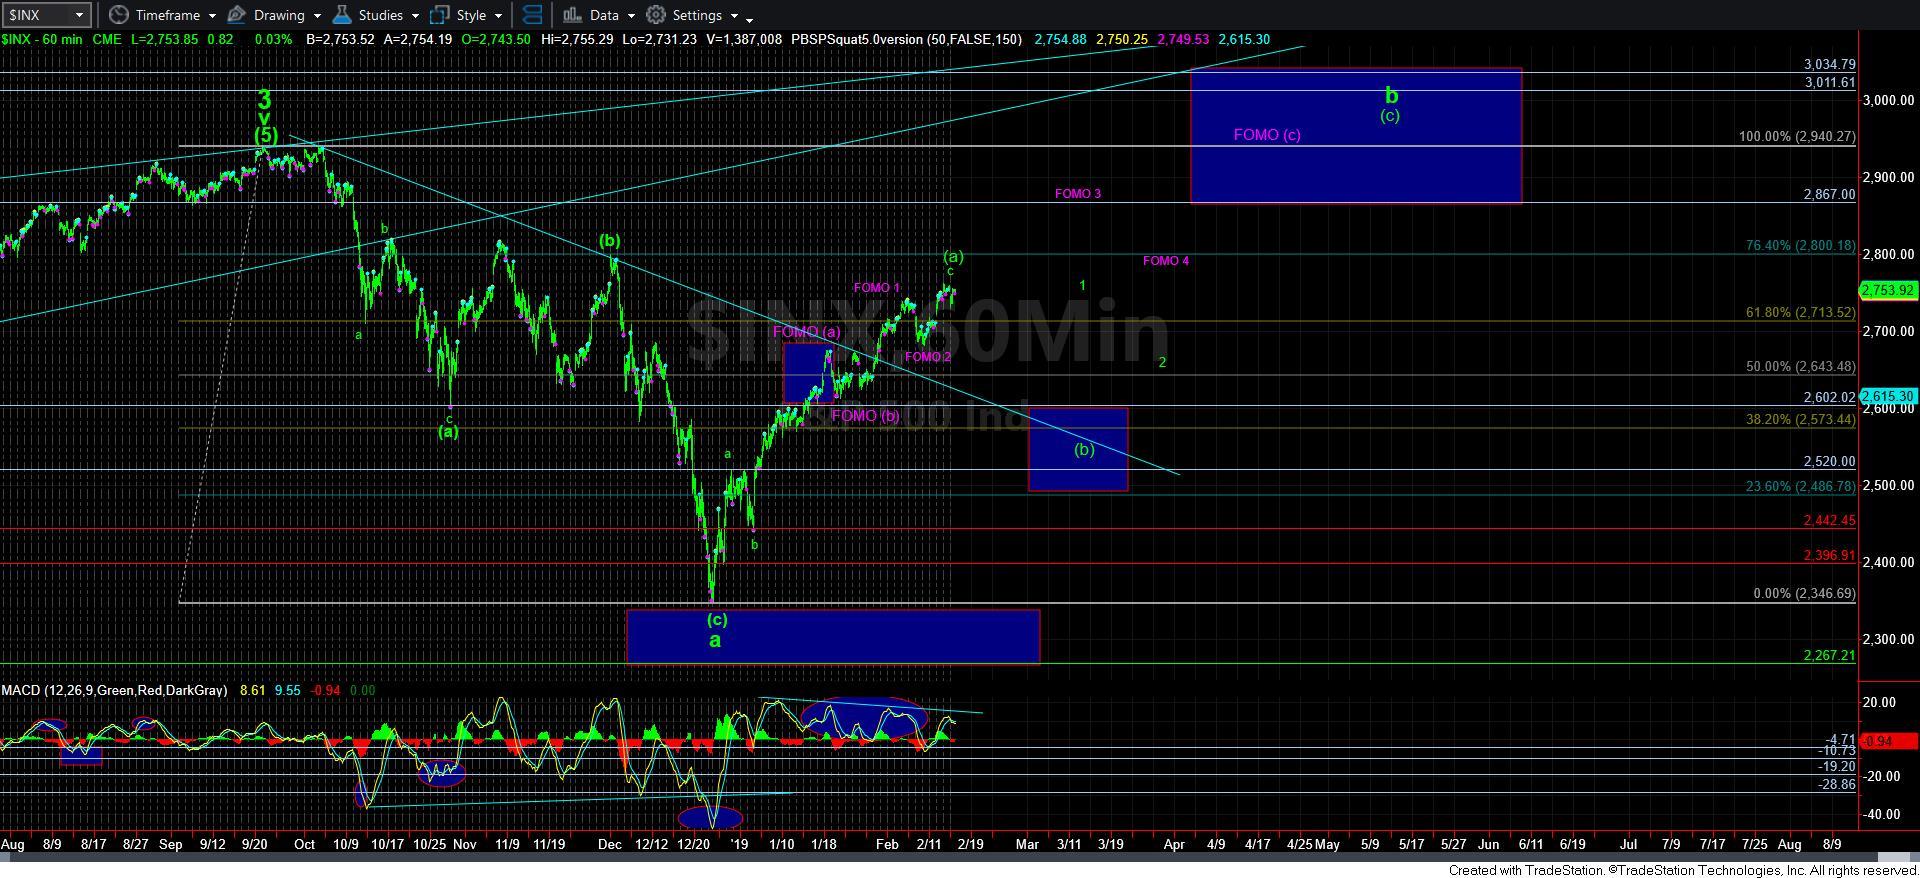
Yet, the problem with this potential is that the initial 5 wave structure off today’s low is only pointing us to the 2770-77 region, right into the top of the main resistance box, which can represent the bigger [a] wave being followed by several of our analysts, which is presented on the 60-minute chart.
So, after providing you with all that analysis, and the issues of confluence between the various patterns, let me try to synthesize this into a trading plan.
As long as the market now holds over 2735SPX, I can continue to look higher in the FOMO count. But, should we break below that level in the coming day or so without making a higher high on this rally, then it places us in a precarious position as there are several potential counts which I will have to track, among them the green count, as well as a more expanded pink count.
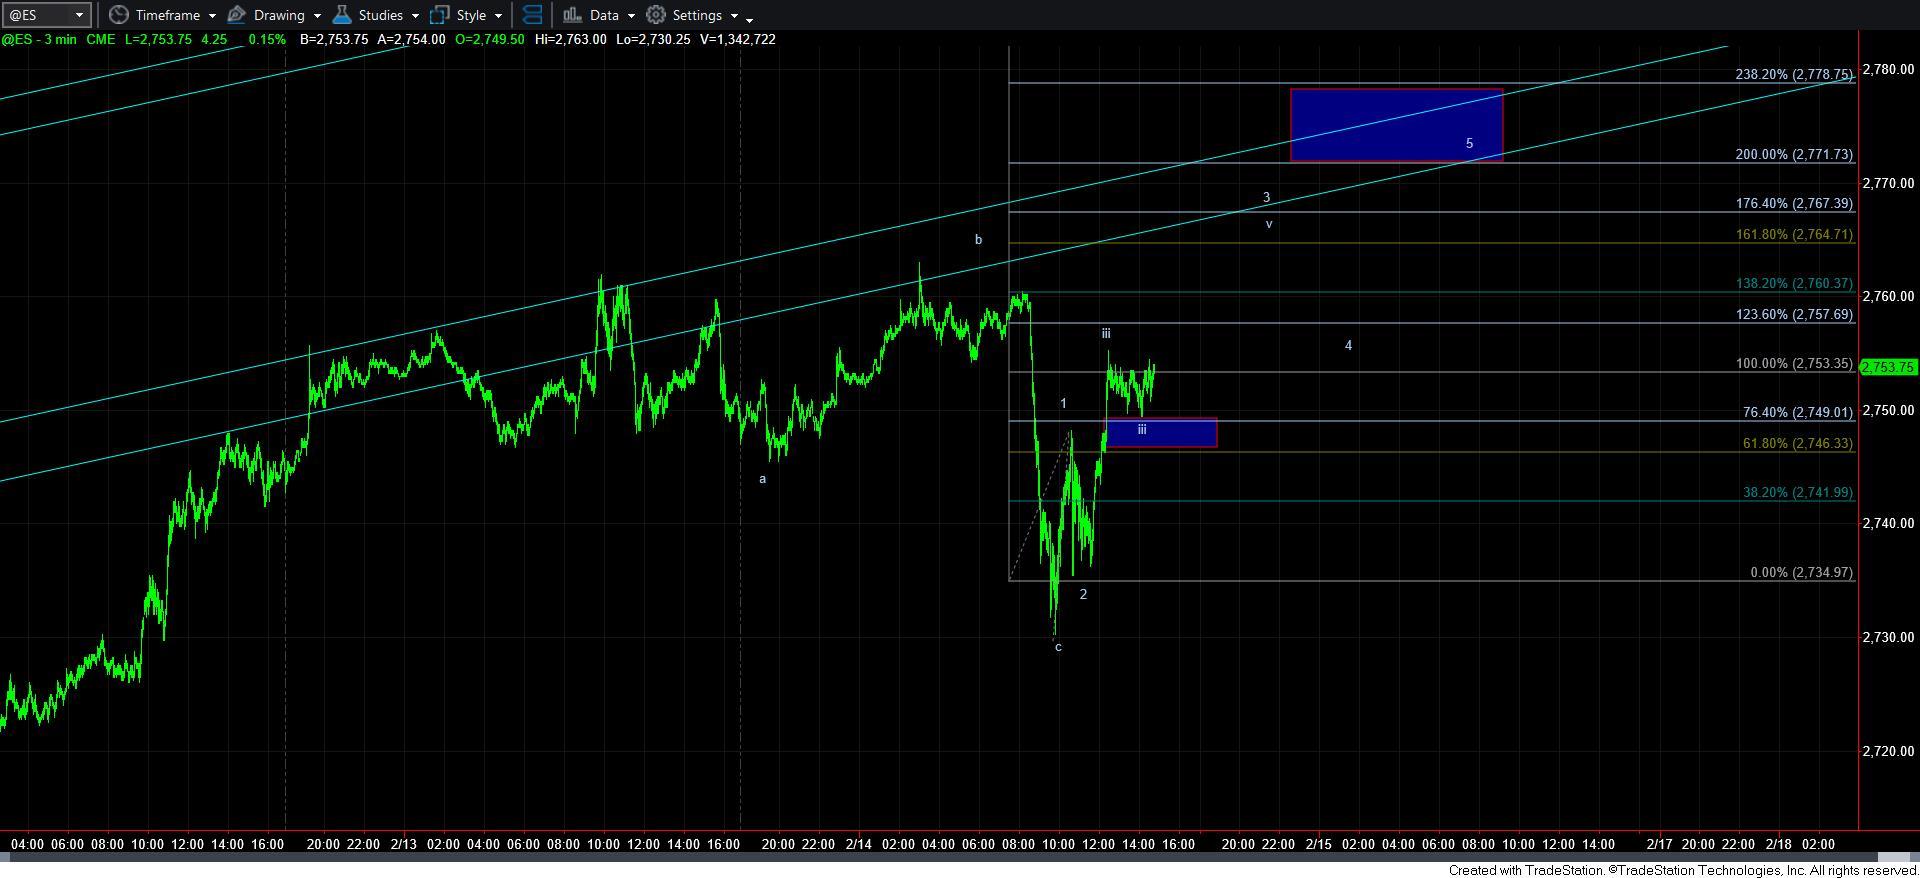
Next, should the market rally up into the 2770-77SPX region, then I would be quite cautious, as that could certainly top us out for the bigger [a] wave pattern, as followed by several of our analysts and presented on the 60-minute chart. So, caution should clearly be maintained if you have a long bias and the market approaches that region while completing a micro 5-wave structure into that region. I have outlined that micro 5-wave structure on the attached 3-minute ES chart, which means 2746ES must hold as support.
However, if the market can blow through the 2777SPX region, and head directly to the 2800SPX region, then we are much more likely in wave 3 in the FOMO count, and we will likely see a wave (iv) pullback into the market pivot box back into the 2750-77SPX region before we head higher to 2850SPX to complete wave 3. I have highlighted that pullback as wave [iv] of 3 in purple on the 5-minute SPX chart.
While this may sound like a complex trading plan, I think we all need to stay on our toes, as the fact that the market has continued to rally despite it not providing a reasonable [b] wave suggests we must remain vigilant. And, as I noted in prior updates, I will continue to adjust support levels, so that if a support level does break, it will be our first indication that a top has been struck, similar to what we did back in the fall of 2018 with the break of 2880SPX. Unfortunately, due to the unusual nature of this market rally, it has forced to maintain such a posture with regard to this rally.
If you still have questions, do not hesitate to ask, as this is clearly much more complex than we had wanted to see.