Market Taking a Breather
 By
By
After several sessions of very high intraday volatility, the market is taking a bit of a breather today, currently down less than 1/2 of a percent at the time of this writing. We are still sitting over support but remain under the next key pivot/resistance level. A break of either of these levels should help provide further guidance as to whether the market still has another lower low to go to finish off this initial move down, or whether Monday’s low may already represent at least a local bottom.
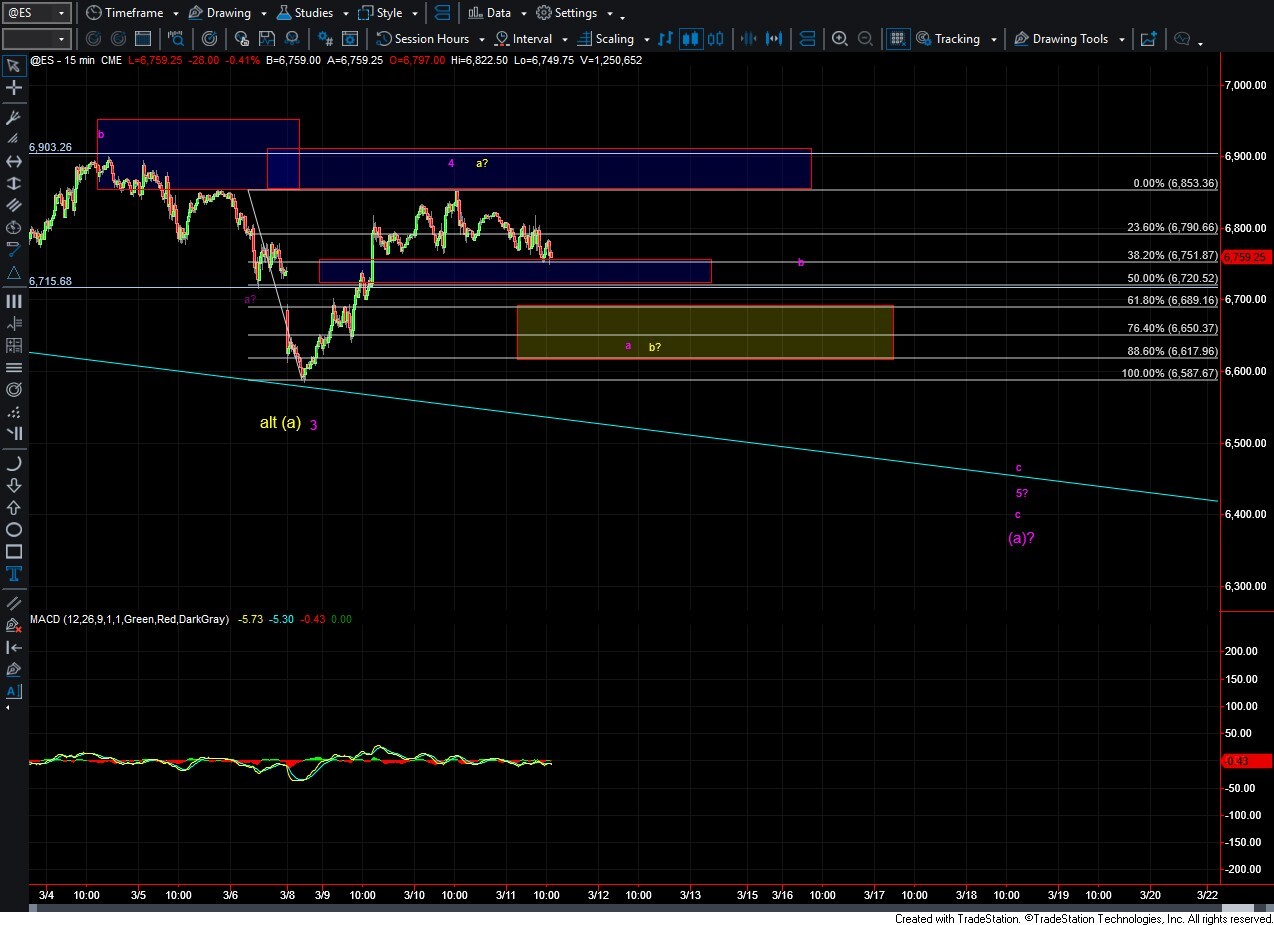
As shown on the ES chart, I am watching the 6715 level as the first key support that would need to break to indicate that we may have put in a local top. If that level breaks, then the 6689–6617 region becomes the next important support zone below. If we are able to hold that support zone and then turn up in five waves, it would indicate that we may have potentially bottomed in all of wave (a) shown in yellow.
If, however, the move to the upside remains corrective in nature, then it would suggest that we still have at least one more lower low to go before completing this initial move down, likely as part of an Ending Diagonal for wave c of (a) as shown in the purple count.
Keep in mind that if we are indeed tracing out a larger Ending Diagonal to the downside, it will be the structure of the next move higher that will likely determine which path the market is following, as the downside action in both counts can still take on a corrective form.
For now, we simply need to watch how the market reacts at the support levels noted above and then evaluate the structure of the next move higher once a local bottom is established.