Market Taking Direct Route?
With the break out over 3080SPX resistance, I have to move to what was formerly my alternative count in green. That suggests the market is heading higher in direct fashion to complete wave [i] off the March lows. And, now, I will track the blue count as my alternative. Allow me to explain the differences.
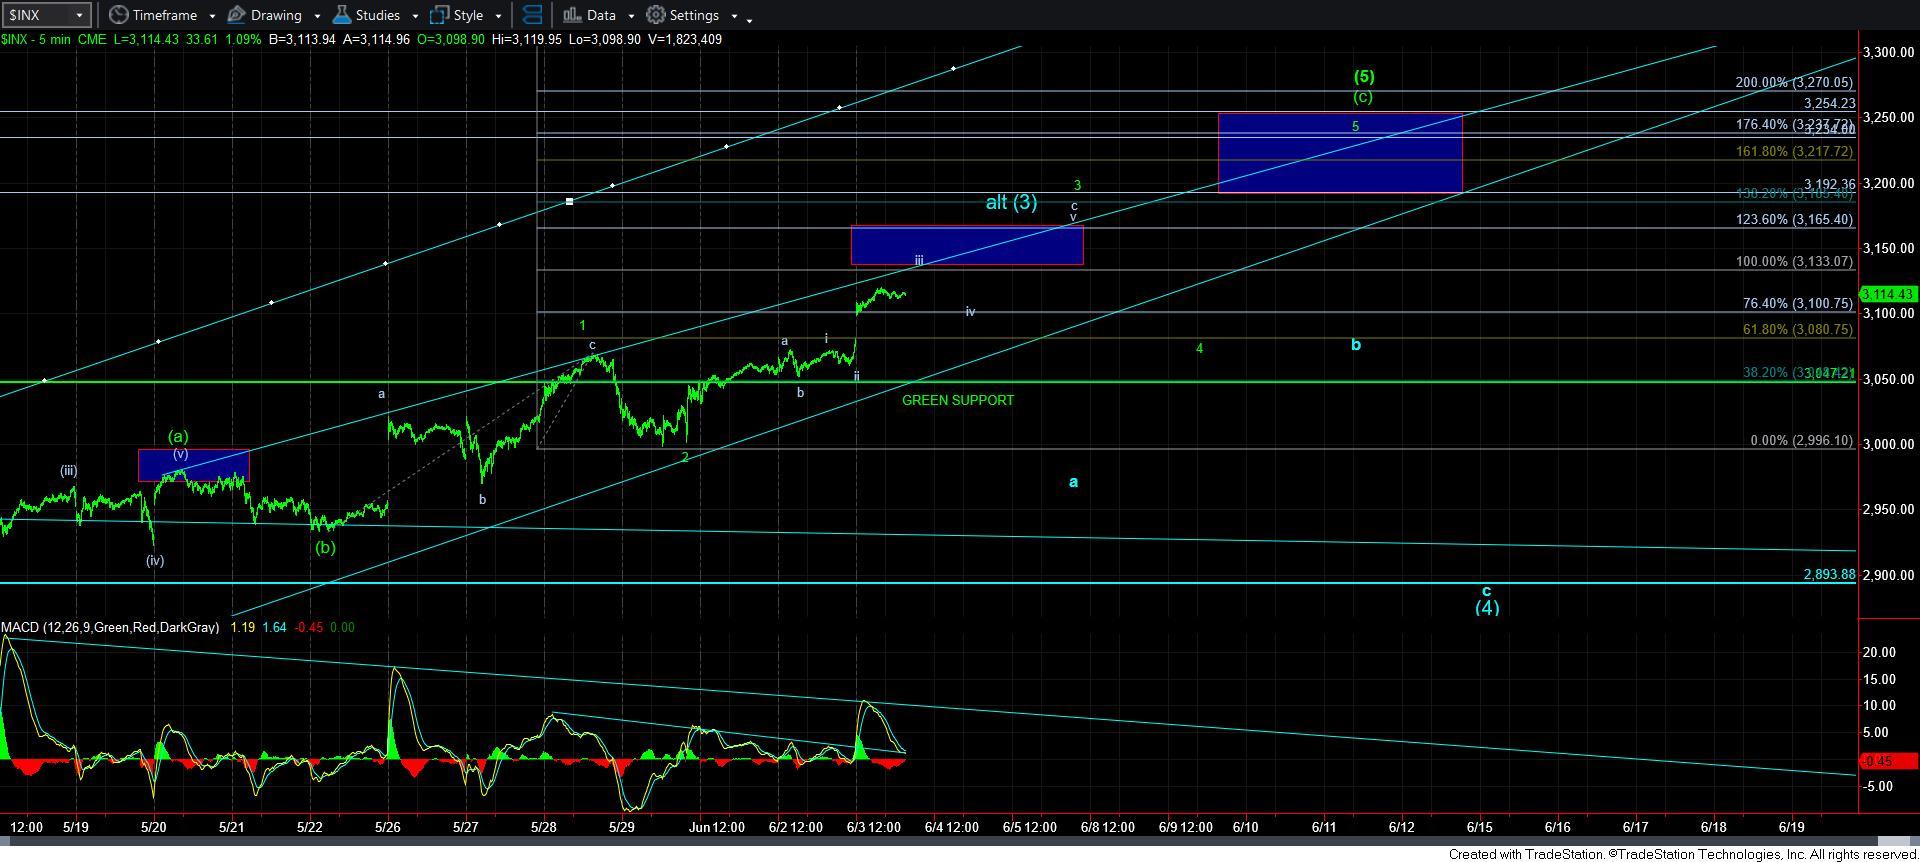
First, I have adjusted the micro count on the 5-minute SPX chart to outline the green count and how it can take us to the wave [5] target region to complete wave [i] off the March lows. At this point in time, I am counting this rally as the c-wave of wave 3 of the [c] wave of wave [5]. You see, the most reasonable manner in which to count this last segment of the rally is as an ending diagonal in the [c] wave of wave [5], which means all substructures will count as a-b-c structures. As I have been noting, this is what has added to the complexity of the current structure, and will likely mean continued volatility.
Moreover, as long as we remain over 3085/3100SPX support, I still think we will see a wave iv and v to complete the c-wave of wave 3 within the [c] wave of wave [5]. You can review the 5-minute SPX chart to see that micro structure.
Furthermore, as long as the market remains over the 3040/50SPX support region around the green line on the 5-minute SPX chart, I still am expecting a wave 4 and 5 to complete this [c] wave of wave [5].
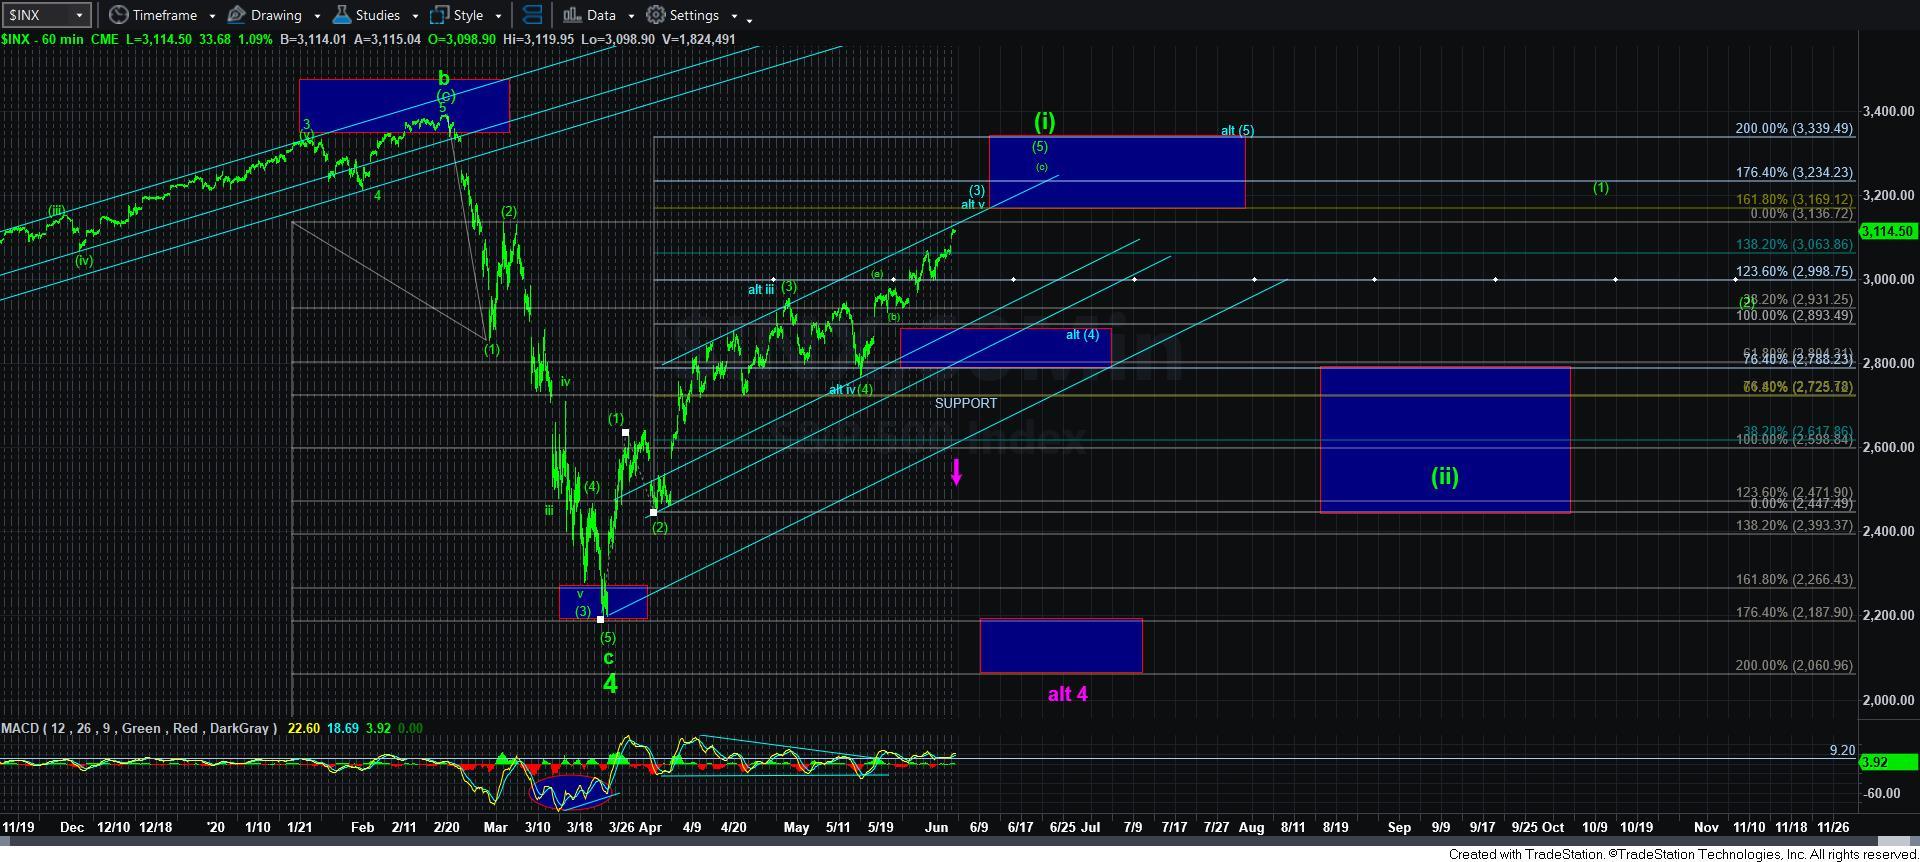
Alternatively, I am viewing this as an extension in the wave [3] in blue, with an ideal target in the 3170SPX region, which is the 1.618 extension of waves [1] and [2] off the March lows. If the market continues up towards that region and then breaks down below 3040SPX, then the 2890SPX region will provide us with an important support point. If the market provides us with an a-b-c structure into that support region, then I would view the high of 3170SPX as wave [3] in blue, with the corrective pullback into the 2890SPX region as wave [4], leading me to expect one more rally in wave [5] of I towards the 3340 region later this summer.
You see, if the market does follow a Fibonacci Pinball structure, and tops out at the 1.618 extension of waves [1] and [2] off the March lows, then wave [4] will often see a pullback to the 1.00 extension, which is in the 2890SPX region.
However, if we top near 3170SPX, and then break below 2890SPX, it makes it rather clear that wave [i] has likely topped and we are in wave [ii]. The structure on the way down to the 2890SPX region will also be quite telling. For if it does not project a bottoming in the 2890SPX region, then it also makes it rather clear that the next larger pullback below 3040SPX is already wave [ii].
So, as we progress through the completion of wave [i] off the March lows, we are approaching the topping region we would normally expect a 5-wave structure to complete. So, as risks rise, one needs to consider that we are likely going to begin a larger degree pullback in the coming weeks. For now, I would say the 3040SPX support is going to be a key region to let us know that the test of the 2890SPX region has likely begun.