Market Takes a Day to Digest Its Gains
 By
By
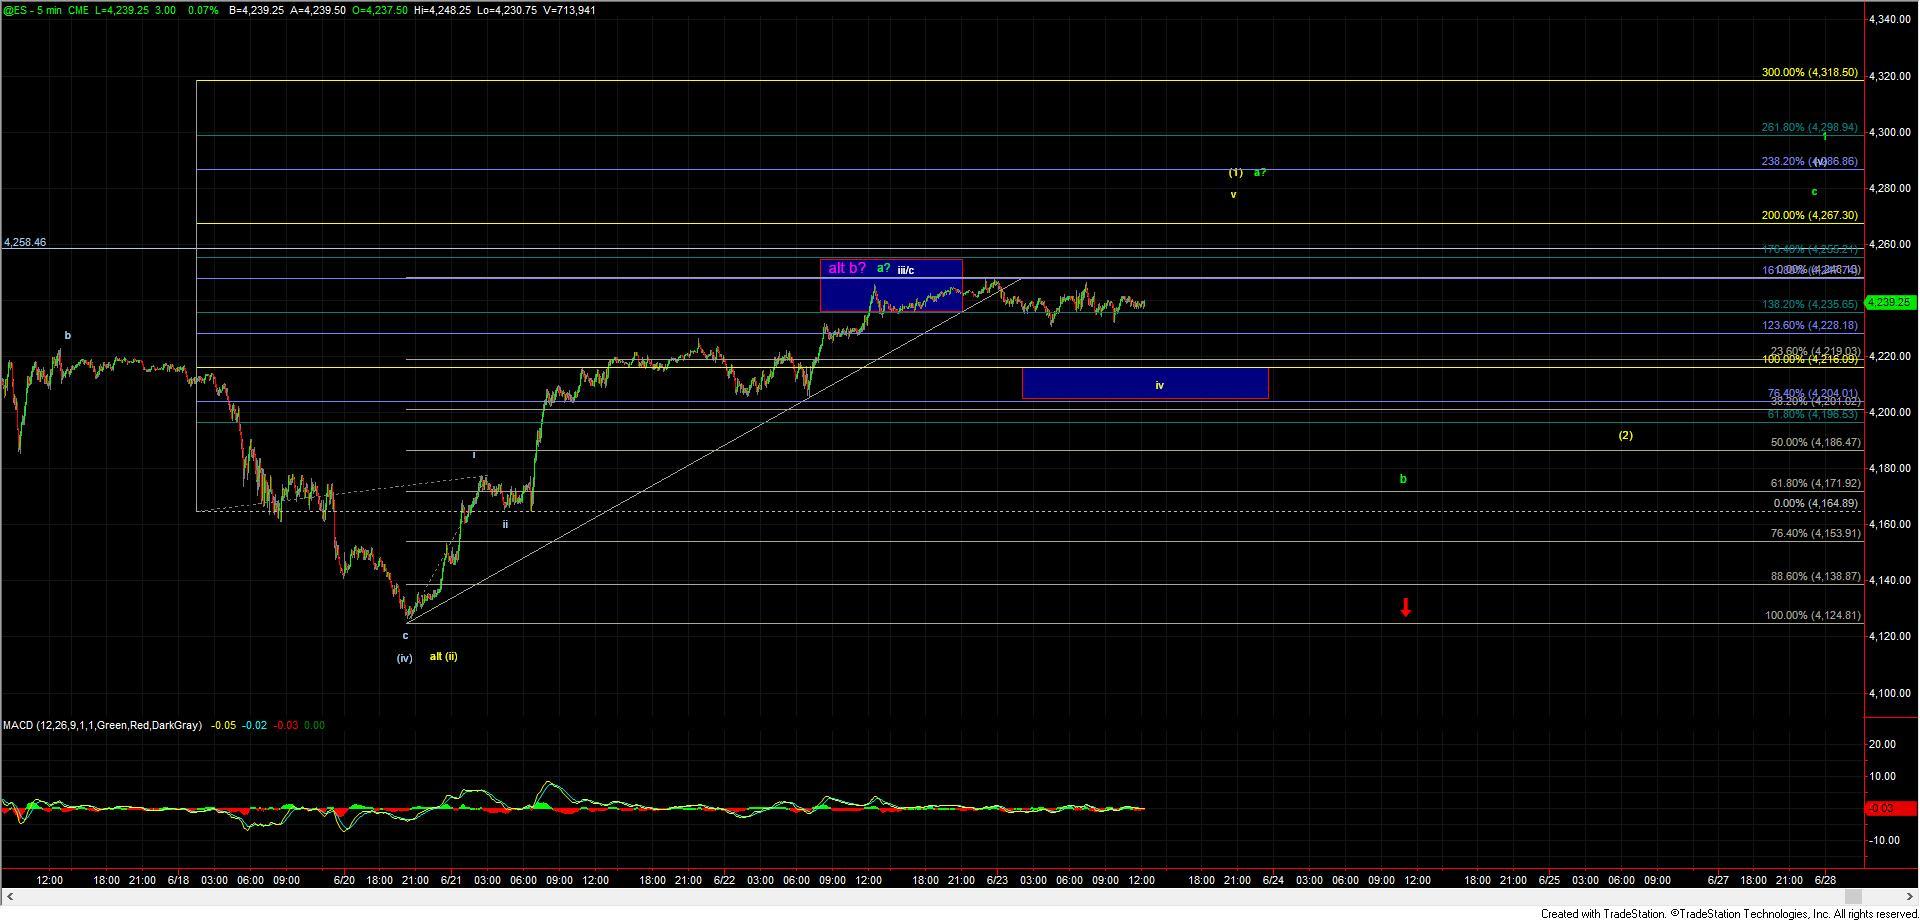
After getting a strong push into the close yesterday we saw the ES consolidate overnight and throughout the entire day. The consolidation occurred right at the 161.8 ext of the initial move up off of the lows and over the upper support zone at the 4216-4204 zone. This is suggestive that this consolidation is a micro wave iv as shown in yellow on the ES 5min chart.
With that as long as we can maintain that 4216-4204 support zone we still can develop a full five up off of the lows which would signal that we should see higher levels after we top in the wave (1) and get a corrective retrace for a wave (2) again as shown in yellow on the charts. That yellow path it would signal that the market is trying to push up towards the 4400+ area and would provide us with a nice buying opportunity upon a wave (2) pullback in yellow as shown on the ES 5 min chart. We do however need to take this one step at a time and first see if we can manage to fill out that full five up off of the lows as indicated per the yellow count.
I do want to note that even if we do see a full five up off of the lows we wont fully be able to eliminate the green ending diagonal path until we see a strong push through the 4283-4312 pivot zone followed by a break of the 4373 level as any five wave move could still just be considered a wave a of (v) under the green counts ending diagonal. A five wave move would however still give that buying opportunity as noted upon a corrective retrace even if we are dealing with the green count.
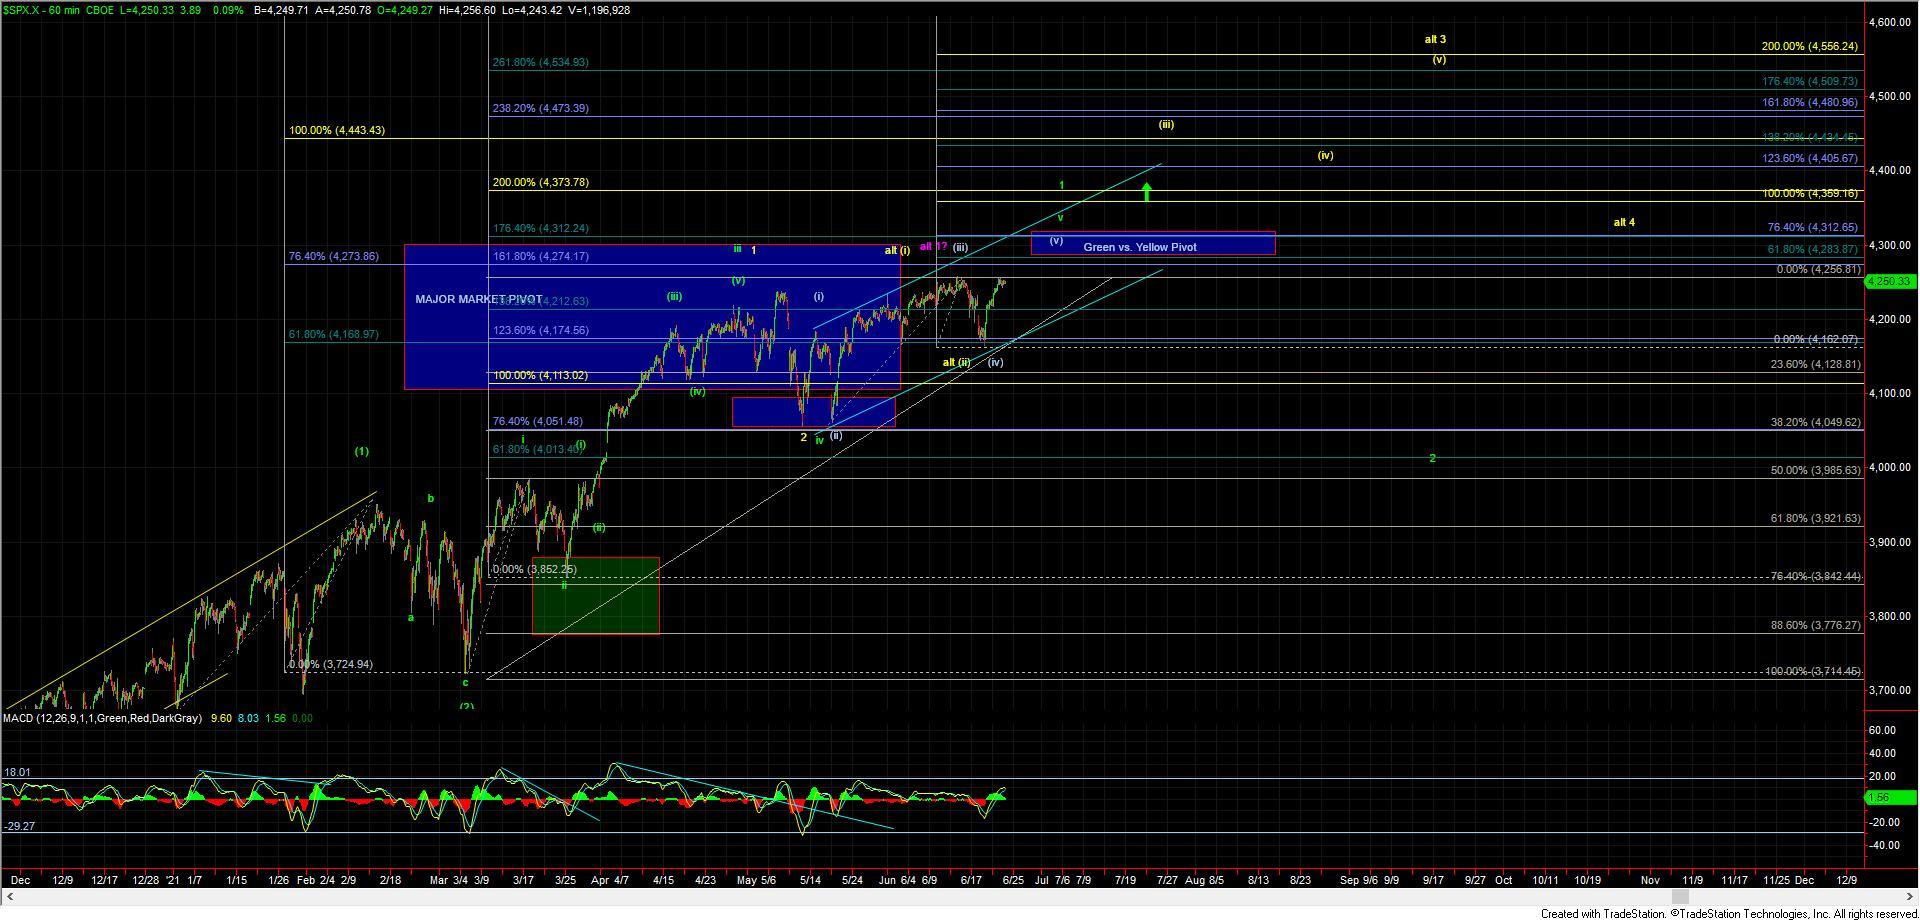
If we drop below the 4196 level before developing a full five up off of the lows, then it would signal that we have topped in the green wave a at which point we watch the 4186-4138 zone below as support for the green wave b. This wave b would likely be part of a larger wave (v) diagonal which should ultimately still take us higher for one more high before topping out at which point we would be looking for that 200-300 point pullback into the summer for the larger degree wave 2 as shown on the SPX 60min chart.
Finally, if the next drop off of the high takes the shape of a full five-wave move to the downside it would open the door to this having topped in the purple wave b. This purple count would suggest that we have already topped in the wave 1 as shown on the SPX 60min chart. There are some structural issues with this count off of the May lows so I am viewing it as lower probability at this point in time. That being said until we are able to breakout back over the 4256 high on the SPX I do have to allow for it as a possibility.
With this strong push into the final hour and as we approach new all-time highs, I wanted to post a supplemental market update outlining the risks and pivot levels should we directly break directly over the previous all-time highs on the SPX at the 4256 level.
Finally, I still want to reiterate the risks that are still in place as we approach a potentially completed ending diagonal pattern off of the 4051 low. As once we do make a new higher high over the 4256 level we will have enough waves in place to consider an Ending Diagonal completed off of the May 13th low. While we still should continue to push higher towards the 4300 even under that Ending Diagonal path before completing there is certainly a decent amount of risk in the near term on the board. When Ending Diagonals pattern complete, they typically will see sharp retracements back towards their origination point. In this particular case, that origination point of the diagonal comes in at the 4059 level.
To reduce the risk of this ending diagonal pattern completing and seeing that retrace towards those levels the market would need to strongly through the 4283-4312 pivot overhead followed by a break of the 4373 level. Moving through those levels would reduce the odds that we are still following the green path and put us on course for the more immediately bullish yellow count.
Unless and until that occurs however we need to remain on our toes here but the market is providing us with some fairly clear parameters to watch here at these levels as we approach new all-time highs.