Market Takes Another Breather But Still Sitting Over Support
 By
By
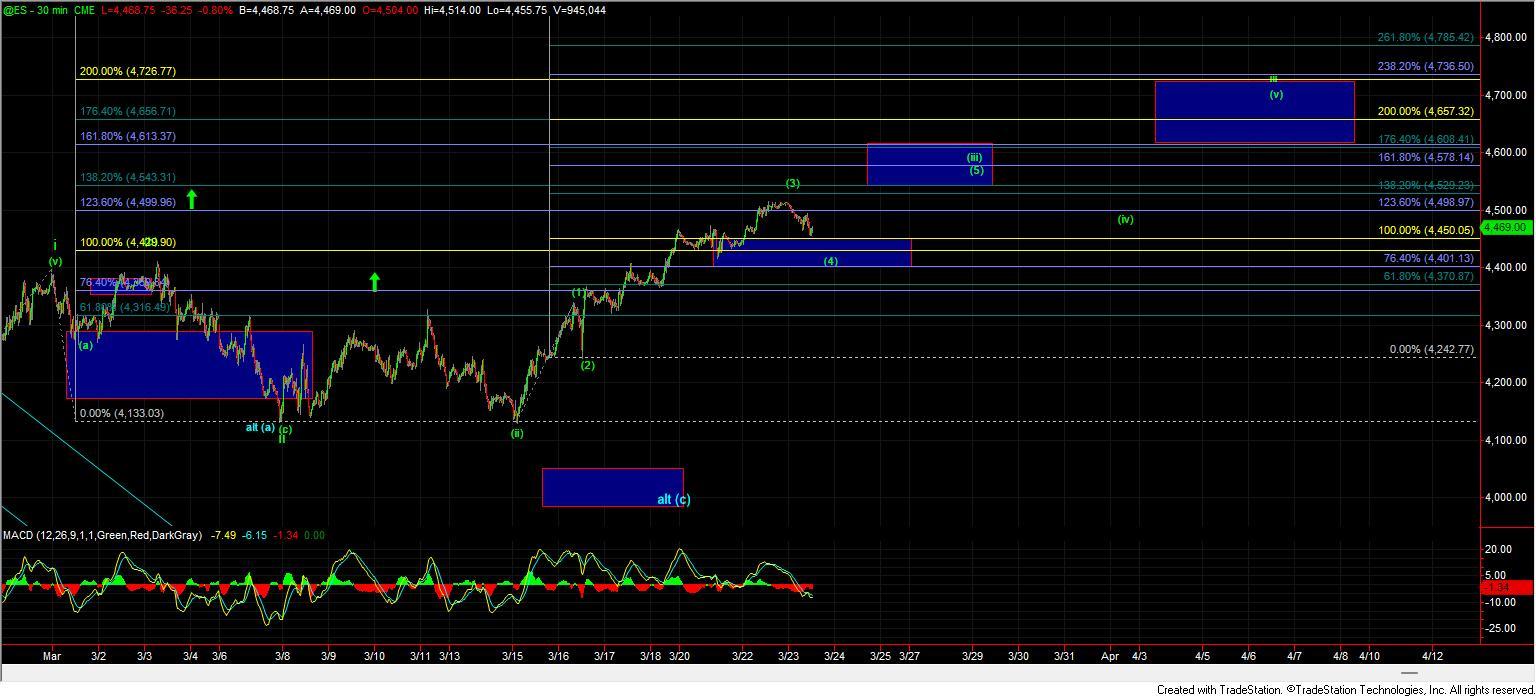
Today's update is very similar to the update that was written on Monday as the market is seeing another pullback in what I am counting as a minor degree fourth wave within a larger degree third wave up off of the lows. Like on Monday this pullback was not terribly unexpected as the market is hitting its head on some fairly key resistance levels have seen a very strong push higher last week. We are however still following our Fibonacci Pinball guidelines quite well here and as long as we continue to remain over-support I am going to give the benefit of the doubt that we are indeed following the primary count shown in green which is keeping the pressure up on this in the near term.
With the push higher, I am moving the ideal support level as shown on the ES chart for the wave (4) up to the 4450-4401 zone. This level represents the 76.4-100 ext of the move up off of the 4133 zone and is the ideal spot for this to hold. Now I will note that it is possible to see this dip a bit deeper into the 4370 level and still keep the bullish impulsive count in play but I would certainly prefer this to hold over the 4401 level. Assuming we can indeed hold that level then I am looking for the wave (5) of (iii) to target the 4529-4608 zone. From there we still would likely need another series of fourths and fifths to give us a full five up off of the lows which should ultimately target the 4730-4800 zone before pulling back for a deeper wave 2 before making another run at the all-time-highs.
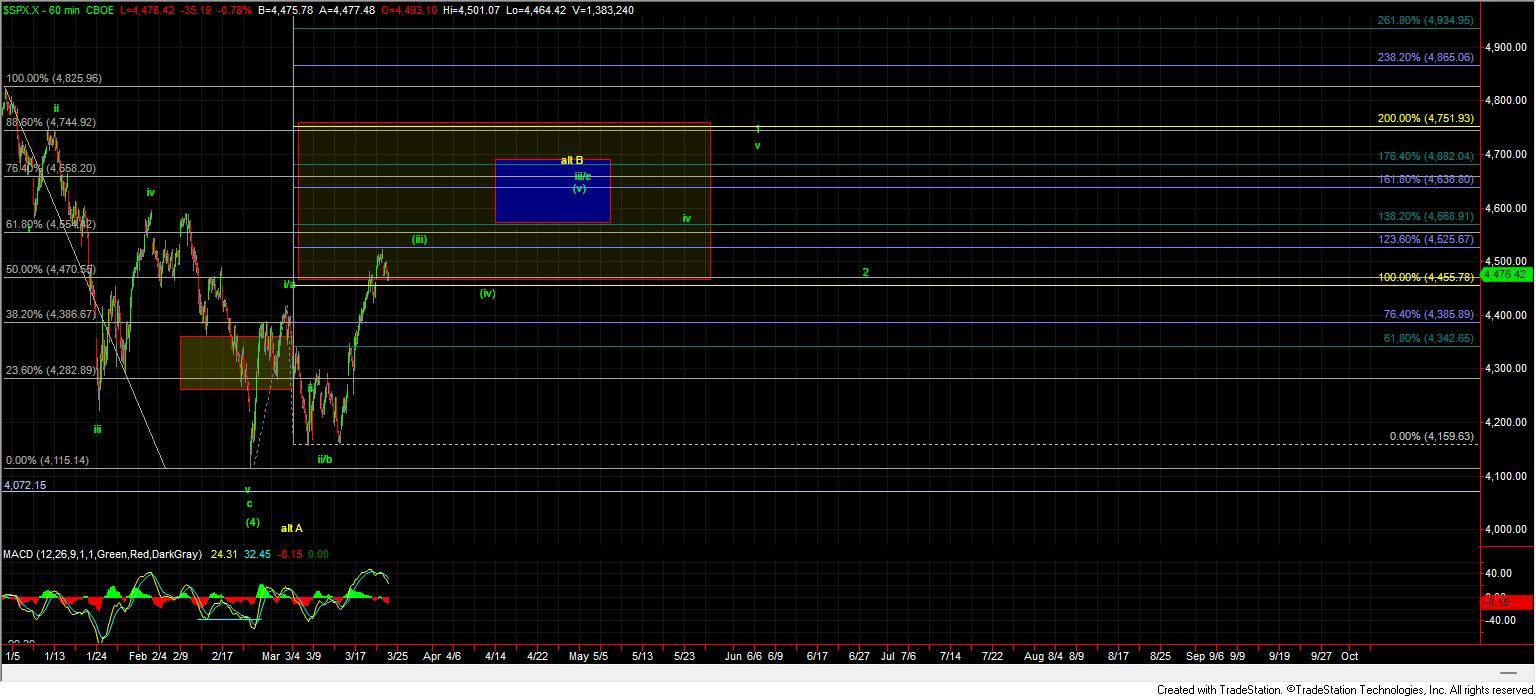
If we are unable to hold the 4401 level but rather break down below that level AND see a full five down off of the highs followed by a break of 4370 then it would open the door for this to be forming a larger wave B top in which case I would count the entire move down into the 4115 low as a large wave A and this move up a large wave B. Reisntace for this wave B comes in at the 4470-4744 zone.
As I noted yesterday, for now, this is simply an alternate count and as long as we hold over support I am still very much leaning towards this having put in a bottom in the larger degree wave (4). I do however need to have an alternate path should we fail to follow through so I therefore will keep the yellow count on the charts until we begin to break out over those upper resistance levels.
So while the market is certainly not moving up in a straight line here we are still following our fib pinball guidelines quite well here so I will simply reiterate that as long as this continues to hold over support I do not see anything to suggest that this is breaking down and my primary count will remain to look higher in the weeks ahead. If support begins to fail then I will adjust those expectations but for now, this is doing what it should be doing in this region.